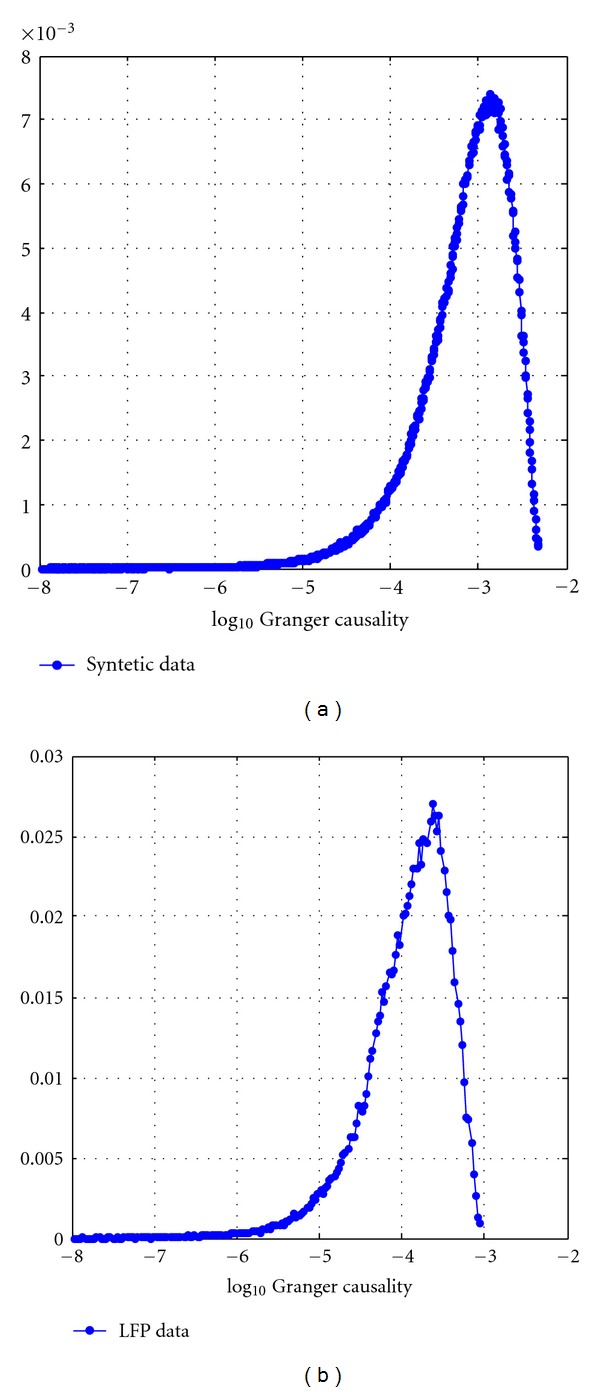
Figure 3.

Distribution of log-transformed Granger causality data. Distribution of the log-transformation Granger causality values for synthetic (a) and LFP data (b). Histograms were computed using a number of bins equal to the square root of the number of elements in data.
