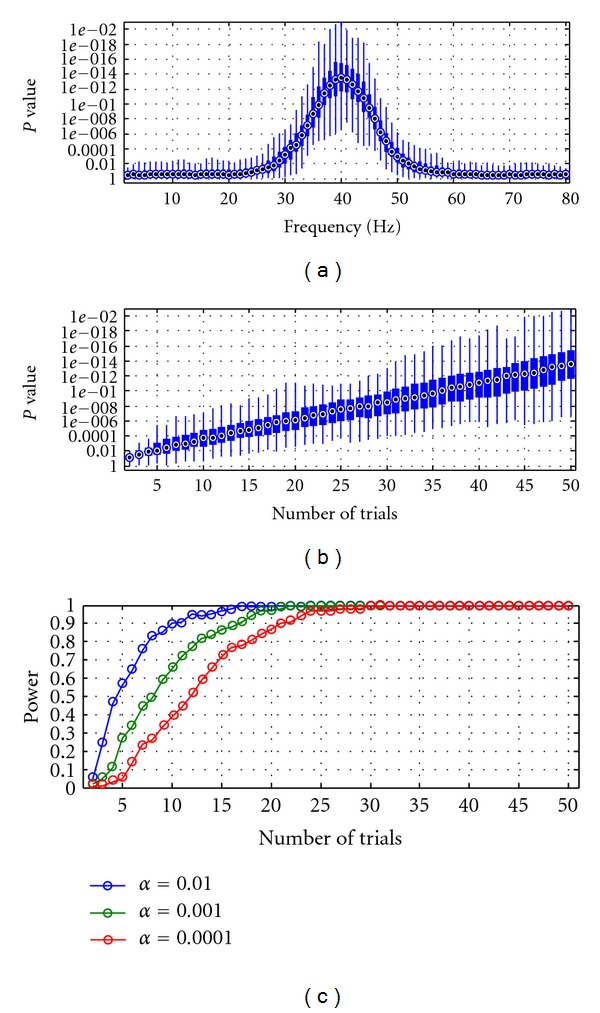
Figure 4.

Simulation 1. (a) Granger causality p-spectra. Boxplot representation of the distribution of the P-values associated with each t-test. At each frequency, the circle in the box is the median value, the edges of the box are the 25th and 75th percentiles, and the whiskers extend to the most extreme data points. The P-values in each boxplot are associated with H 1∶log10I(n)2→1 > log10I(n)1→2. (b) Boxplot of the P-values plotted over the number of trials simulated in each session. (c) Statistical power curves at three levels of significance α = 0.01, 0.001 and 0.0001. By convention, the minimum required power of 0.8 was set as a cutoff for the determination of the minimum number of trials required to obtain a significant discrimination of the directional coupling in the data.
