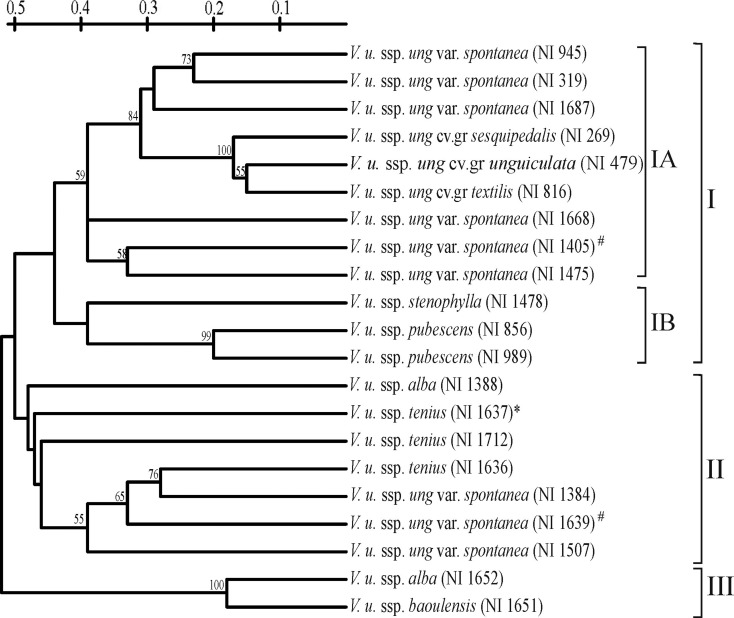
Fig. 2.
UPGMA cluster analysis of 21 V. unguiculata genotypes based on the AP-PCR marker data. Numbers at nodes indicate bootstrap values (in %) for a 1000-replicate analysis. An asterisk indicates the V. u. ssp. tenuis accession that showed intra-genomic ITS (Vijaykumar et al. 2010) and hashes indicate the V. u. ssp. unguiculata var. spontanea accessions that showed single type 5S IGS (Vijaykumar et al. 2011).

