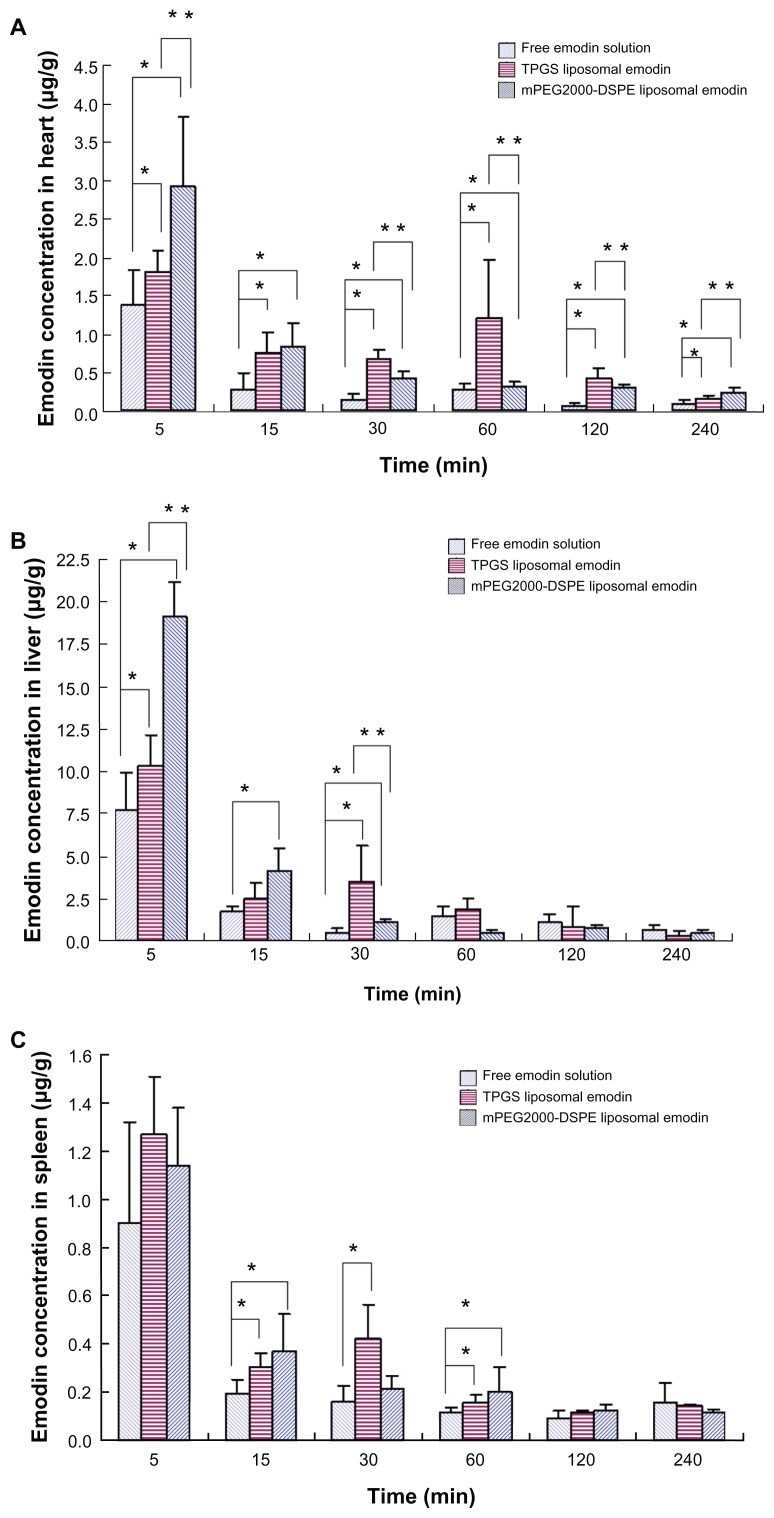
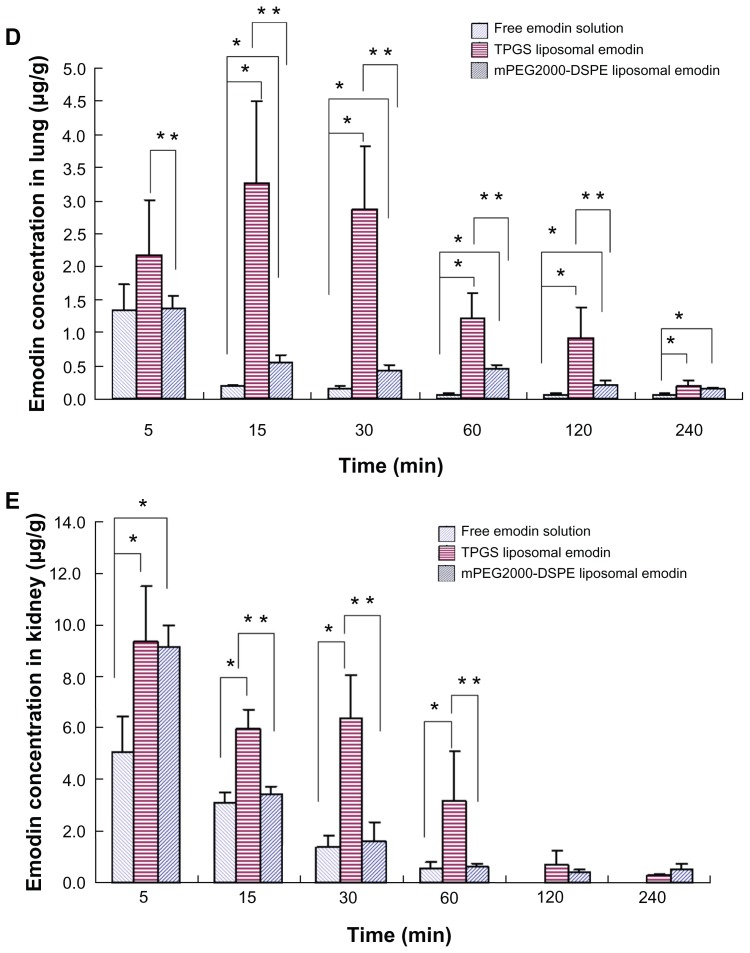
Figure 7.
Biodistribution of emodin in the (A) heart, (B) liver, (C) spleen, (D) lung and (E) kidney (n = 5).
Notes: *Refers to significant difference in comparison with free emodin solution (P < 0.04); **refers to significant difference in comparison with TPGS liposomal emodin (P < 0.04).
Abbreviations: TPGS, D-α-tocopheryl polyethylene glycol 1000 succinate; mPEG2000–DSPE, methoxypolyethyleneglycol 2000-derivatized distearoyl-phosphatidylethanolamine.


