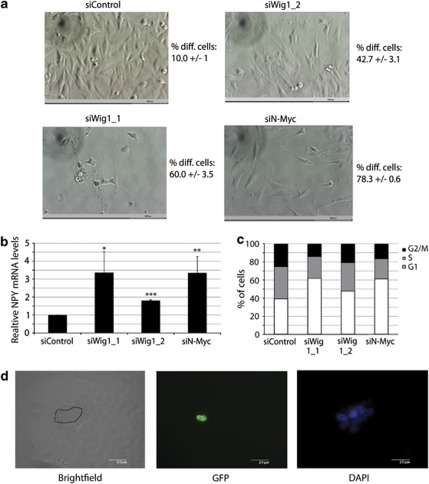
Figure 3.
Wig-1 knockdown causes differentiation in SK-N-BE(2) cells carrying N-Myc amplification. (a) Phase-contrast images of SK-N-BE(2) cells 4 days after siRNA transfection at × 20 magnification. Scale bars indicate 1000 μm. Control transfected cells are confluent and cells are growing as solitary cells with square-like morphology. Wig-1 knockdown using two different siRNA oligos or N-Myc knockdown causes morphological changes associated with differentiation to varying degree. Cells become less confluent and neurite outgrowths appear. Numbers next to images indicate the average percentage of differentiated cells ± standard deviation of three independent experiments, of at least 50 counted cells per experiment. To examine the effect of Wig-1 knockdown on the differentiation-associated marker NPY we transfected cells with siRNA oligos against Wig-1 or N-Myc, harvested cells after 4 days, isolated RNA and performed quantitative real-time PCR. (b) Increased levels of NPY (P=0.025 with siWig-1_1 and 4.7 × 10⁻⁶ for siWig-1_2) after Wig-1 knockdown (n=3) compared with control PGK1 levels. Error bars show S.D. (b). To examine the effect or Wig-1 and N-Myc knockdown on cell cycle distribution in SK-N-BE(2) cells, we performed FACS-PI cell cycle analysis 4 days after siRNA transfection. Wig-1 knockdown resulted in a 58% (P=0.0002; siWig-1_1) or 22% (P=0.032; siWig-1_2) increase in the G1 fraction of cells, whereas N-Myc knockdown resulted in a 56% (P=0.0001; siN-Myc) increase (c) (n=5). To confirm that the effect of Wig-1 on differentiation is caused by downregulation of N-Myc, we cotransfected SK-N-BE(2) cells with Wig-1 siRNA and GFP-tagged N-Myc ORF construct lacking the 3′UTR (and therefore not regulated by Wig-1). Cells were fixed and mounted for immunofluorescence 5 days after transfection. (d) shows a GFP-N-Myc ORF-expressing cell (cell borders marked in black) surrounded by non-transfected cells. The GFP-N-Myc-expressing cell remains undifferentiated whereas the surrounding cells that do not express GFP-N-Myc show a differentiation-associated morphology. All images are at × 63 magnification. Scale bars indicate 20 μm. For more examples, see Supplementary Figure 2a

