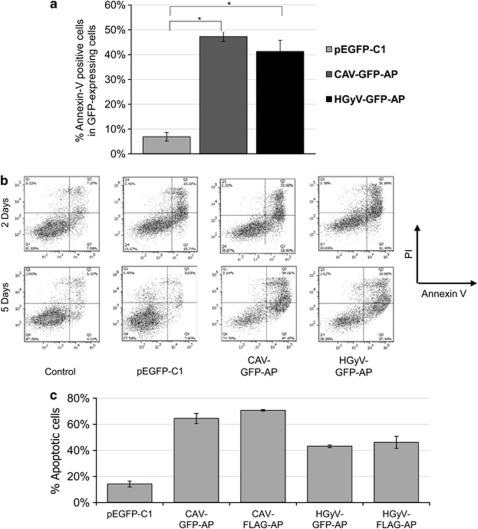
Figure 3.
Induction of cell death in Saos-2 cells at 5 days after transfection. Saos-2 cells were transfected by nucleofection with pCAV-GFP-AP, pHGyV-GFP-AP or the corresponding pEGFP-C1 control plasmid, as well as pCAV-FLAG-AP and pHGyV-FLAG-AP. Cell death was measured by flow cytometric analysis after Annexin-V-APC/ PI staining. (a) Quantification of cell death as % of APC-labelled cells in the GFP-positive population after 5 days (*P<0.01). Error bars indicate standard deviation of three experiments. (b) Corresponding FACS dot plots of Annexin-V-APC (x-axis) versus PI (y-axis) obtained after 2 and 5 days. (c) After 5 days transfected Saos-2 cells were fixed, stained with a primary mouse anti-FLAG and secondary FITC anti-mouse antibody (for pCAV-FLAG-AP and pHGyV-FLAG-AP) and counterstained with DAPI for the detection of nuclear morphology. Cell death was quantified as the percentage of GFP- or FLAG-positive cells showing condensed or fragmented nuclei. Error bars indicate standard deviation of two independent experiments

