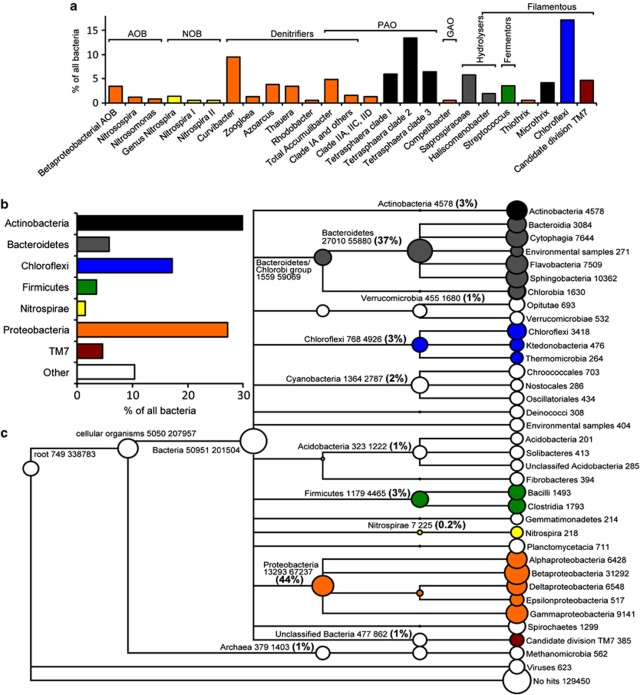
Figure 1.
Comparison of the metagenome and qFISH results for Aalborg East EBPR plant. (a) Detailed qFISH results. ‘% of all bacteria' is the specific probe compared with the EUBmix probes. The probe-defined groups in the top left panel have been grouped according to functional class and colored according to their phylogenetic classification. (b) qFISH results summed to phylum level to facilitate comparison with the metagenome data. (c) Overview of the metagenome binning based on MEGANs lowest common ancestor approach. ORFs were assigned based on a 10% bitscore difference to other BLAST hits; only nodes with over 200 ORFs assigned are shown. The numbers after descriptions denotes, respectively, the number of ORFs assigned to the particular node and the sum of ORFs assigned below the particular node. AOB, ammonia-oxidizing bacteria; GAO, glycogen-accumulating organism; NOB, nitrite-oxidizing bacteria; PAO, polyphosphate-accumulating organism.

