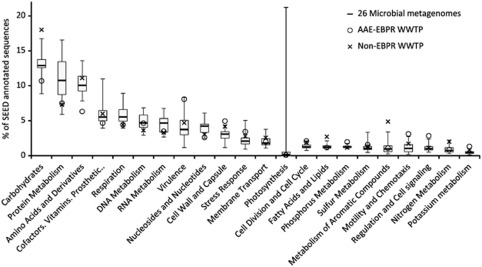
Figure 3.
SEED subsystem comparison of the functional potential of the Aalborg East EBPR metagenome with a non-EBPR WWTP metagenome (Sanapareddy et al., 2009) and an average of 26 microbial metagenomes from six distinct biomes (Dinsdale et al., 2008). The data for the 26 microbial metagenomes is shown in a box plot with median, 25th percentile, 75th percentile, minimum and maximum values depicted.

