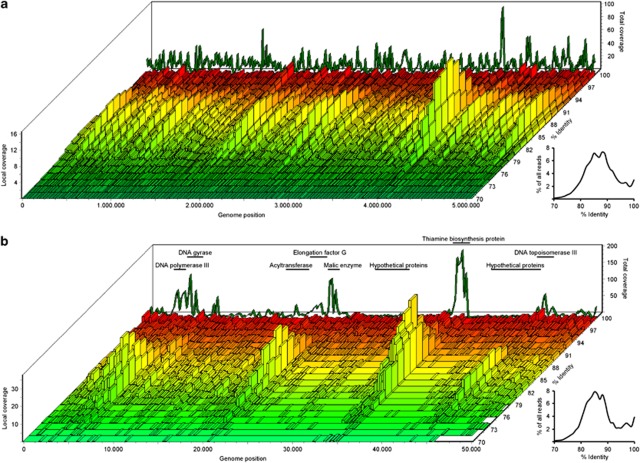
Figure 4.
Graphical overview of the mapping of the short metagenome reads to the genome of Accumulibacter clade IIA strain UW-1 as a function of percent identity of each read. rRNA and tRNA genes have been masked. In the back of the figure, the summed coverage for a given genome position is shown. To the right of each figure, an insert presents the overall read identity compared with the genome. (a) Overview of the full genome. Each bar represents an average read coverage of 10 000 bases. (b) Zoom on the first 50 000 bases. Each bar represents an average read coverage of 200 bases. Selected core and hypothetical genes have been marked on the figure to highlight the difference in coverage of functional annotated genes versus hypothetical proteins.

