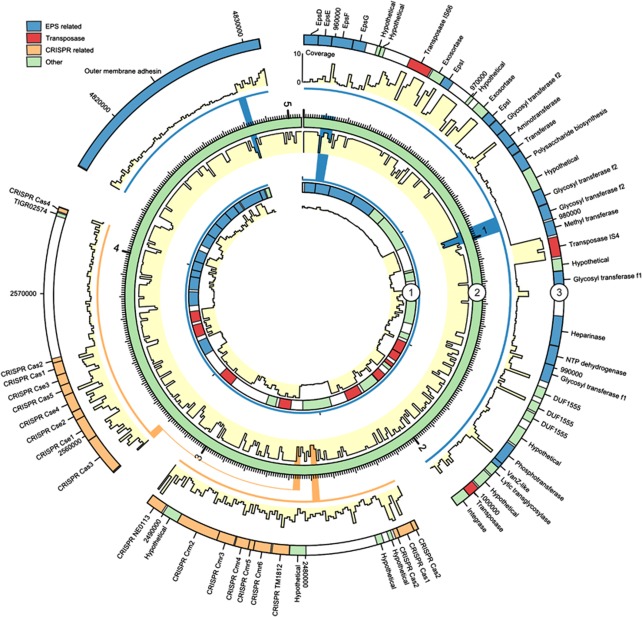
Figure 5.
Circular visualization of gene clusters unique to Accumulibacter clade IIA strain UW-1. Ring two represents the full Accumulibacter genome and in ring one and three selected areas of the genome have been expanded. Below each ring, the coverage profile is shown (yellow fill). The coverage profiles were calculated on the basis of the reference mapping and binned in either 10-kb (ring two) or 200-bp fragments (ring one and three). The coverage profile maximum was set at 10 to facilitate visualization (average coverage). Small marks represent 10 kb of sequence in all rings.

