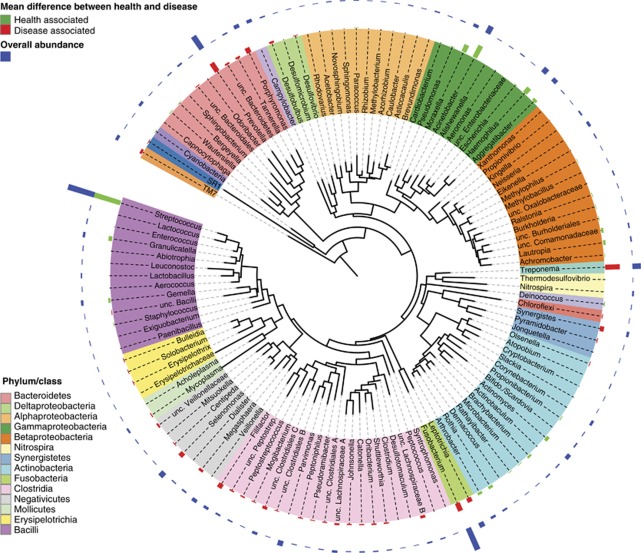
Figure 1.
Circular maximum likelihood phylogenetic tree at level of genus. The inner band shows genera colored by phylum or class (see key for taxa with multiple members), the next band shows significant mean differences between healthy controls and deep pockets (colored green for genera higher in healthy pockets and red for genera higher in disease pockets), and the outer band shows overall relative abundance. The tree was constructed in iTOL (Letunic and Bork, 2007).

