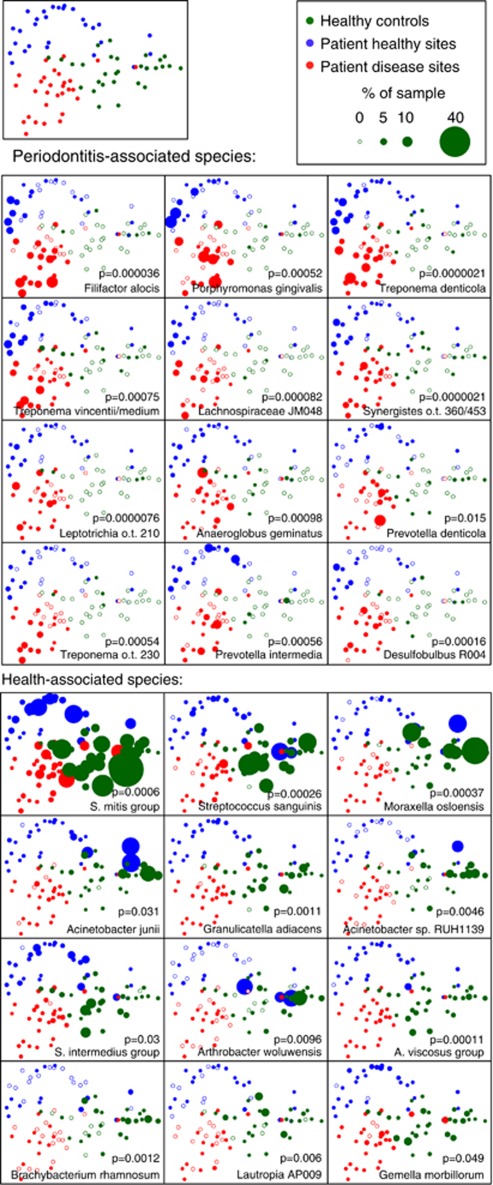
Figure 3.
PCoA plots of the UniFrac distance for samples by disease status. Samples from healthy control subjects and deep and shallow sites from subjects with periodontitis are shown. All plots show the ordination of all the samples. The upper-left panel shows unweighted points, and the lower arrays show points weighted by abundance for the 12 species most strongly associated with periodontitis and health. Empty symbols indicate zero abundance of the species.

