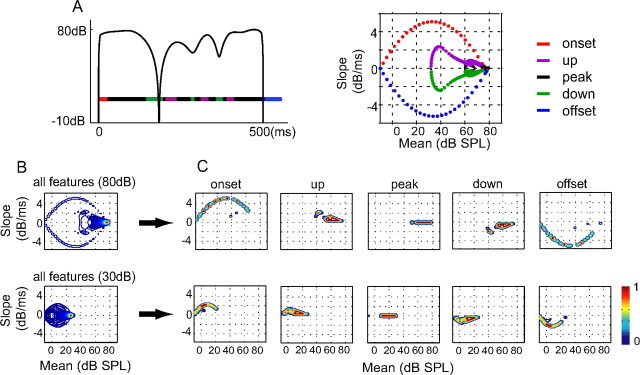
Figure 1.
Envelope features of the aAM stimuli. A, Envelope of an aAM stimulus with a peak level of 80 dB SPL (left) and its mean–slope trajectory (right). Envelope segments with positive, zero, and negative slope values and their associated mean–slope trajectories are plotted in different colors. Each color dot on the mean–slope trajectory marks the mean–slope values of one 25 ms envelope segment. B, Contour plots of the mean–slope distributions of total envelope features in 10 aAM stimuli played at 80 and 30 dB SPL. C, Contour plots of the mean–slope distributions of five envelope feature types at 80 and 30 dB SPL. The color of a contour line indicates the peak-normalized magnitude of a distribution.

