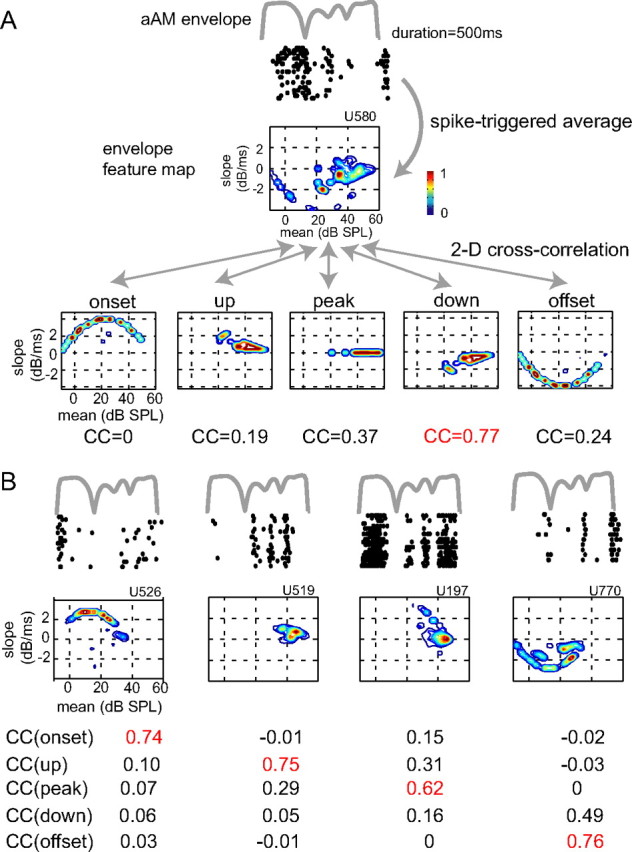
Figure 2.

Characterization of envelope feature selectivity of A1 neurons. A, Shown from top to bottom are the envelope of an aAM stimulus at 60 dB SPL, the raster plot of corresponding responses of an example neuron, its envelope feature map, and the mean–slope distributions of five feature types of aAM stimuli at 60 dB SPL. The preferred feature type of a neuron was determined by the strength of the two-dimensional (2-D) correlation between the envelope feature map of a neuron and the mean–slope distributions of five envelope feature types. As highlighted in red, the down type yielded the highest CC and was then designated as the preferred envelope feature of this neuron. B, Raster plots and envelope feature maps of four other example neurons whose ID numbers are shown on top of feature maps. Based on the maximal strengths of correlation values with five envelope feature types (red), the preferred envelope feature types for the four example neurons from left to right are onset, up, peak, and offset. The peak SPLs used were 40 dB SPL for the onset and offset neurons, 60 dB SPL for the up neuron, and 50 dB SPL for the peak neuron. The FPI of the five neurons was in turn 0.63, 0.56, 0.66, 0.63, and 0.63. The aAM waveform lasted 500 ms and neural responses between 15 ms after the stimulus onset and 65 ms after the stimuli offset were analyzed. The raster plots were advanced 15 ms to visually align with the envelope of the aAM stimulus.
