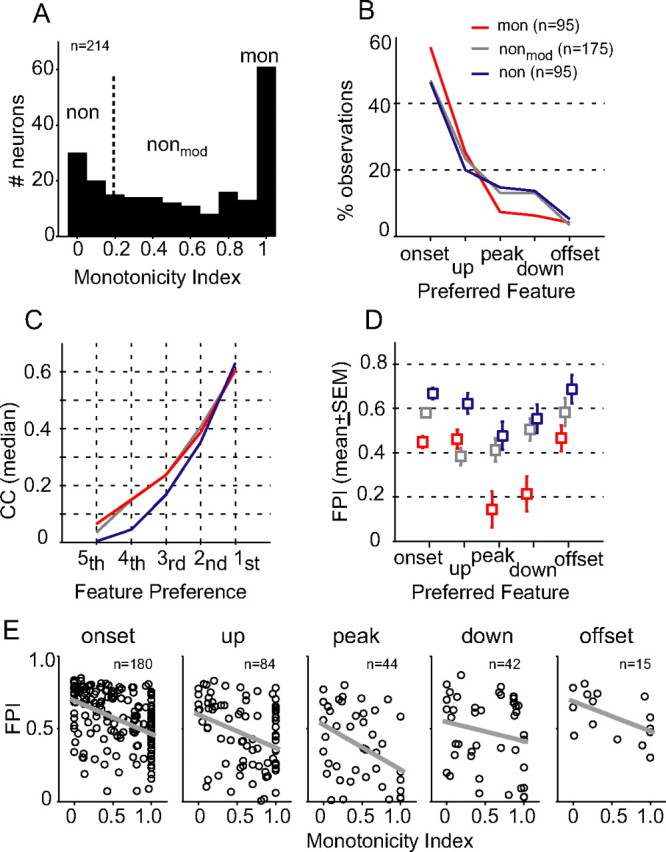
Figure 3.

Comparison of envelope feature selectivity between monotonic and nonmonotonic neurons. A, Distribution of MI. For data analyses, the neural population was divided into three subgroups based on MI values (Table 1). B, Percentage of observations of feature types for the three neural groups. Neurons that were tested at more than one SPL contributed multiple observations. C, Ordered correlation coefficients (median) between stimulus-response feature maps, as demonstrated in Figure 2. The highest rank (first) is associated with the preferred feature type of a neuron. D, FPI (mean ± SEM) of monotonic (red), moderately nonmonotonic (gray), and highly nonmonotonic neurons (blue) for each feature type. E, Scatter plots of FPI as a function of MI for five feature types. Gray, Best-fit linear regression.
