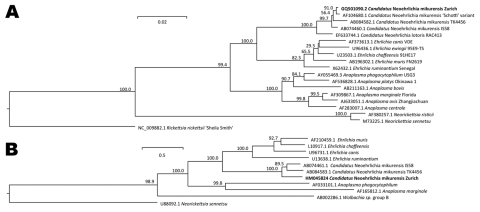
Figure 2.
A) Phylogenetic tree based on the 16S rRNA gene sequences of Candidatus Neoehrlichia mikurensis GQ501090.2 (our patient’s isolate, herein termed Zurich and indicated in boldface) and related organisms. The number at nodes indicates percentages of bootstrap support based on 10,000 replicates. Scale bar indicates 0.02 substitutions per nucleotide position. B) Phylogenetic tree based on the groEL sequences. Scale bars indicate 0.05 substitutions per nucleotide position.

