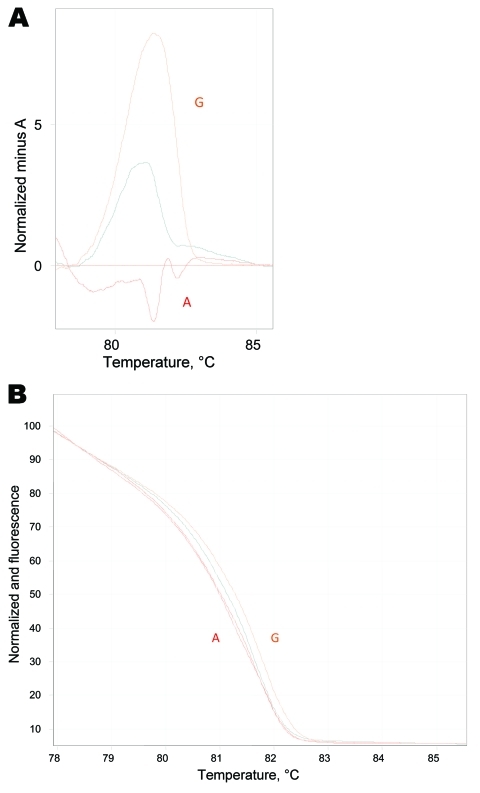
Figure 2.
Real-time PCR high-resolution melting assay. A) High-resolution melt profiles are shown for wild-type (WT) Mycoplasma pneumoniae A (A2063A), macrolide resistance mutation G (A2063G) sample, and the mixed genotype sample in the normalized graph mode. B) Temperature-shifted difference graph demonstrates the deviations between WT, resistant, and mixed samples. The WT isolate has been selected to normalize the temperature shift graph and displays the deviation of samples from it.

