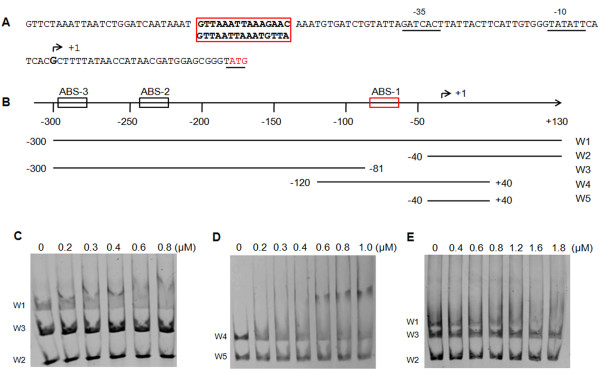
Figure 4.
ArcA binding to theompWpromoter region. A.S. Typhimurium ompW promoter region. Black and red boxes indicate predicted ArcA binding sites. -10 and −35 boxes are underlined. The transcription start site is shown in bold and indicated as +1. The translation start site is underlined and in red. The consensus ArcA binding site is shown under the promoter sequence. B. Schematic representation of the ompW promoter region. Positions relative to the transcription start site are indicated. ArcA binding sites are indicated as in the text. PCR products used in EMSAs are shown and names of each fragment are indicated. C,D and E. EMSA of the ompW promoter region. A 3-fold excess (60 ng) of fragments W2 and W3 were incubated with W1 (C) and the fragment W4 was incubated with W5 (D) and increasing amounts of phosphorylated ArcA as indicated on the top of each gel. (E) W1, W2 and W3 were incubated with increasing amounts of non-phosphorylated ArcA

