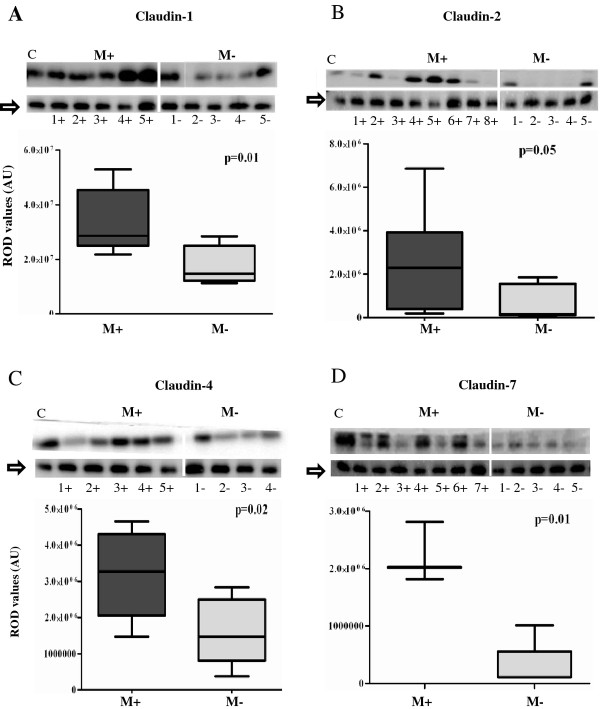
Figure 1.
Comparison of expression levels of claudins- 1 (1A), 2 (1B), 4 (1C) and 7(1D) in Misoprostol treated (M+) (samples 1+ to 7+) versus untreated (M-) (samples 1- to 5-) cervix. Representative immunoblots in the top panels whilst box plots, lower panel, represent mean (SE) relative optical densities (ROD) for all studied tissues: M+ (n = 10) vs. M- (n = 5). Block arrows showing Gβeta as internal loading control at 35 kDa. C-positive control in the first lane. C-1 = claudin-1; C-2 = claudin-2; C-4 = claudin-4; C-7 = claudin-7. ROD- relative optical density in Arbitrary Units (AU).

