Figure 2.
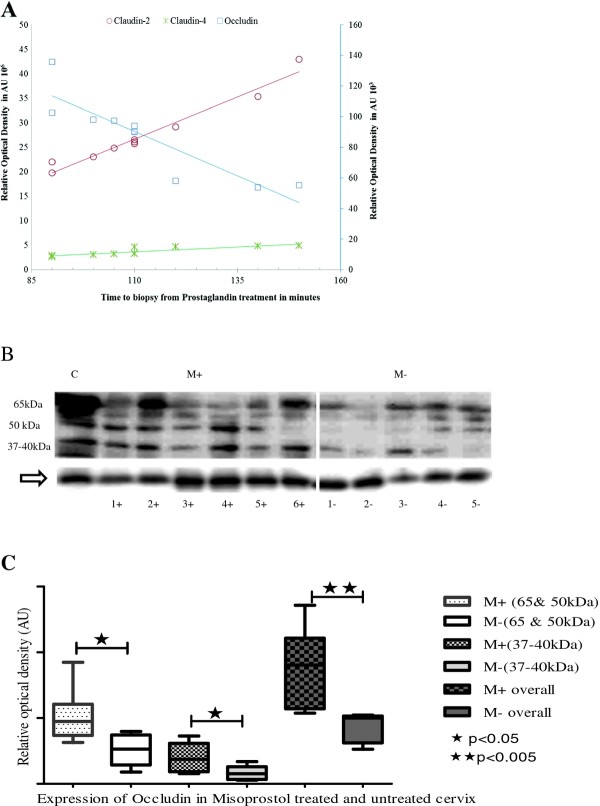
a: Scatter plot and trend-lines demonstrating positive correlation of claudin-2 (r 0.98, P < 0.001) and claudin-4 (r 0.86, P < 0.05) expressions, and negative correlation of occludin expression (r -0.90, P < 0.05), with time from Misoprostol treatment (M+) to cervical biopsy in minutes. Occludin relative optical density (ROD) in arbitrary units (AU) is plotted on a secondary y-axis (right) whilst the ROD for claudin-2 and claudin-4 are shown on the primary y-axis (left). b: Representative immunoblots depicting significant increase in all isoforms of occludin with Misoprostol treatment (M+) compared to the untreated (M-) cervix in the first trimester of pregnancy. Arrow at G-βeta as internal loading control. C-positive control. c: Box plots comparing mean (SE) relative optical densities (ROD) of different isoforms of occludin for all studied tissues: Misoprostol treated (M+, n = 10) vs. Untreated (M-, n = 5). LMW-low molecular weight at 37-40 kDa; HMW- high molecular weight at 50 & 65 kDa; overall- LMW and HMW combined.

