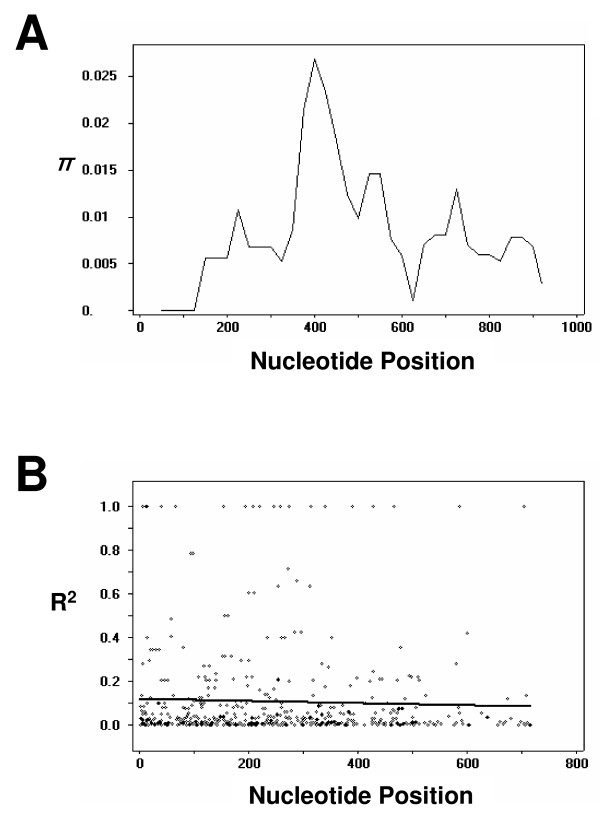
Figure 3.
Natural selection of PvDBPII. (A) Sliding window plot of nucleotide diversity per site (π) comparing the level of genetic diversity at PvDBPII. The π values were calculated on DnaSP with window length 100 bp and step size of 25 bp. (B) The linkage disequilibrium (LD) plot showing non-random association between nucleotide variants in 54 Myanmar P. vivax isolates at different polymorphic sites. The R2 values are plotted against the nucleotide distances with two-tailed Fisher's exact test of significance.

