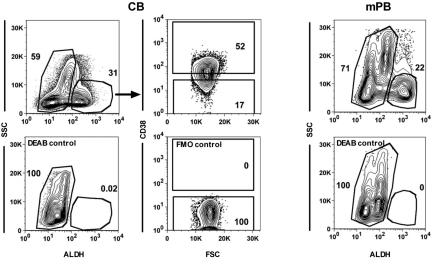
Figure 3.
Isolation of different subsets of human CB and mPB cells. Representative FACS plots showing gates used to isolate ALDH+ and ALDH− CB (top left panel) and mPB cells (top right panel) and the CD38+ and CD38− subsets within the ALDH+ CB cells (top middle panels). Bottom panels show the controls for each of these staining.

