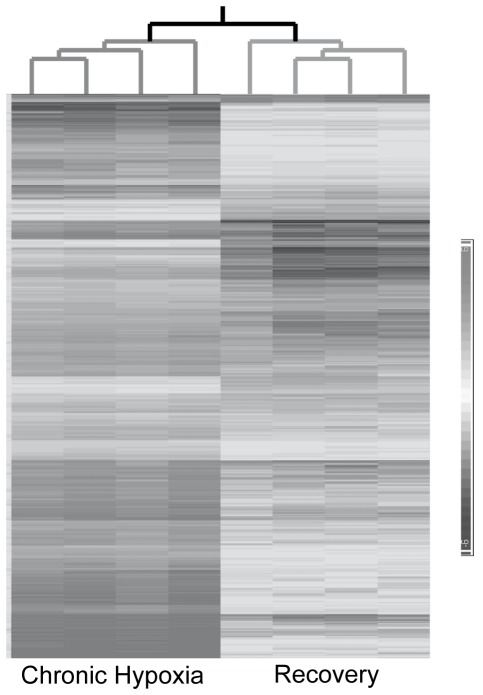
Figure 2. Heatmap and dendrogram representations of all 512 transcripts that were differentially expressed in CH and REC.
Each column represents one sample (chip) and each row a differentially expressed transcript. The intensity of the transcript expression is indicated by the gray shaded bar at the right side of the figure. The four chronic hypoxia (CH) and recovery (REC) GeneChip data sets cluster into two distinct groups based on correlation of gene expression pattern. The dendrogram branches lengths for CH and REC sub-trees seen at the top are based on normalized raw data of all transcripts and quantitatively demonstrate that the four samples are closely related to each other. Each horizontal bar represents one probe set, and the intensity of gray color of the bar determines the degree of expression.

