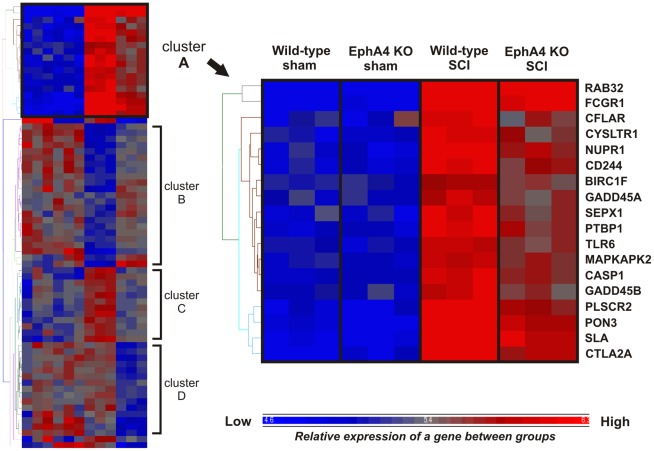
Figure 1. Hierarchical clustering of differentially expressed genes generated by comparison of injured wild-type and EphA4 knockout samples.
Hierarchical clustering identified subsets of differentially expressed genes with similar expression profiles across groups. A cluster was chosen for further analysis (enlarged, cluster A); expression of genes in this cluster was relatively low in both sham-operated wild-type and EphA4 knockout samples and increased after injury in both genotypes. However the upregulation in injured EphA4 knockout samples was attenuated compared to injured wild-type samples. A number of genes with this expression profile were related to inflammation or immune function. KO = knockout.

