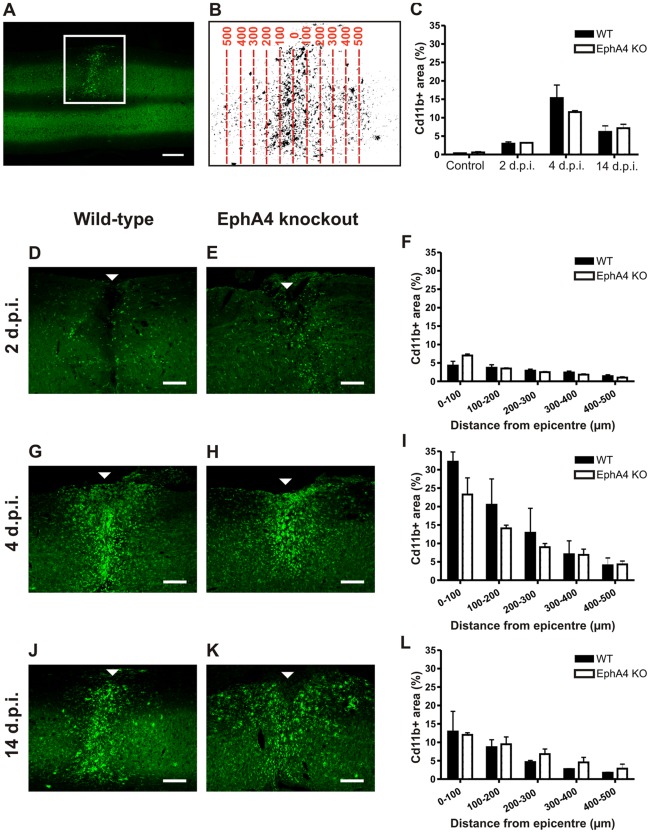
Figure 3. The rostro-caudal area and spread of macrophages/activated microglia does not differ between injured EphA4 knockout and wild-type spinal cords.
Horizontal sections of spinal cord were immunostained with CD11b to label infiltrating macrophages and activated microglia. An example is shown in the low power image in A; the square surrounds the CD11b+ lesion on the left hand side of the spinal cord. CD11b immunoreactivity was converted to a positive area of staining by thresholding, and the proportional area of staining was analysed in 100 µm zones from the injury epicentre up to 500 µm rostrally and caudally (the example in B shows the injured left hand side of the spinal cord in A at higher power). Injured wild-type and EphA4 knockout spinal cords were analysed at 2 (D, E), 4 (G, H) and 14 (J, K) days post-injury (arrowheads indicate the injury epicentre). There was no significant difference between genotypes in the proportional CD11b+ area of any 100 µm rostro-caudal zone at 2 (F), 4 (I) or 14 (L) days post-injury. or within the total 1 mm rostro-caudal area in control spinal cords (C). Results show mean ± SEM of n = 3 wild-type and n = 2 EphA4 knockout controls; n = 3 per genotype at 2 and 4 days post-injury and n = 2 per genotype at 14 days. Scale bars: A = 500 µm; D, E, G, H, J, K = 200 µm. WT = wild-type, KO = knockout, d.p.i. = days post-injury.

