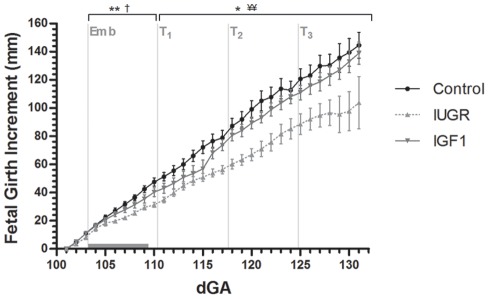
Figure 1. Fetal growth rate presented as the increase in girth size (mm) relative to the starting date of measurements (101 dGA).
Data points are the means with SEM. Emb marks the start of the embolization period, which is indicated by the horizontal gray bar. At T1, T2 and T3 the IUGR and IGF1 groups received intra-amniotic saline or IGF-1 injections, respectively. * p<0.05 and ** p<0.01 for IUGR vs. Control; † p<0.05 for IGF1 vs. Control; ¥¥ p<0.01 for IGF1 vs. IUGR.

