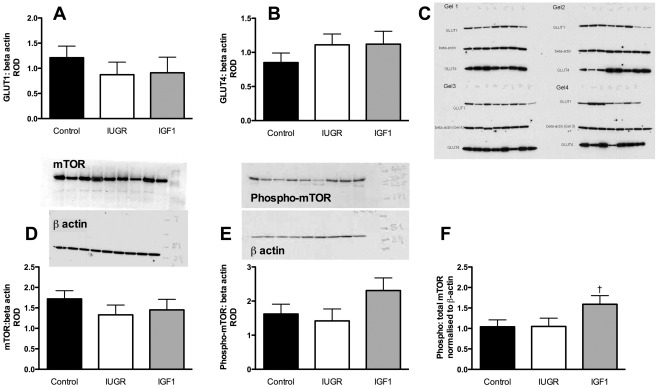
Figure 5. Placental protein levels of glucose transporters 1 and 4 and mammalian target of rapamycin (mTOR).
[A] SLC2A1 (GLUT1), [B] SLC2A4 (GLUT4), [C] total mTOR, [D] phosphorylated mTOR (phospho-mTOR), and [E] the ratio of phospho-mTOR to total mTOR. Data are relative optical densities (ROD, mean±SEM) of the protein of interest normalised to the ROD of the loading control (beta-actin). Black bar, control, n = 11; white bar, IUGR, n = 9; grey bar, IGF1, n = 7. Complete gels are shown, with all four gels for SLC2A1 and SLC2A4 and representative gels for mTOR and phospho mTOR. † p = 0.06 compared with IUGR.

