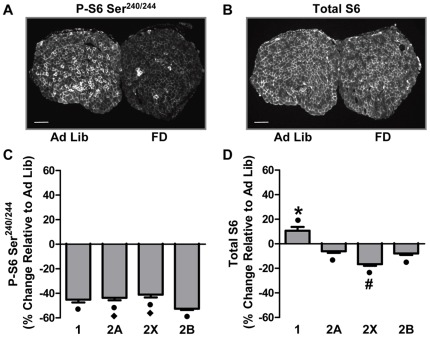
Figure 3. Food Deprivation Induces Fiber Type-Dependent Changes in Ser240/244 Phosphorylated and Total Ribosomal S6 Protein.
Plantaris muscles obtained from control (Ad Lib) and 48 h food deprived (FD) mice were frozen adjacent to one another, cross-sectioned, and then subjected to immunohistochemistry for different fiber types as described in Figure 1, and Ser240/244 phosphorylated S6 (P-S6 Ser240/244) or total S6. (A) Representative images of P-S6 Ser240/244 and (B) total S6. (C) The effect of FD on the relative amount of P-S6 Ser240/244 and (D) total S6, within each fiber type. The bars in A and B indicate a length of 200 μm. All values are presented as the mean + SEM (n = 60–250 fibers / group from 5 independent pairs of muscles). • Significant effect of FD within a given fiber type, ♦ significantly different from type 2B fibers, * significantly different from type 2A, 2X and 2B fibers, # significantly different from type 1, 2A and 2B fibers, (P<0.05).

