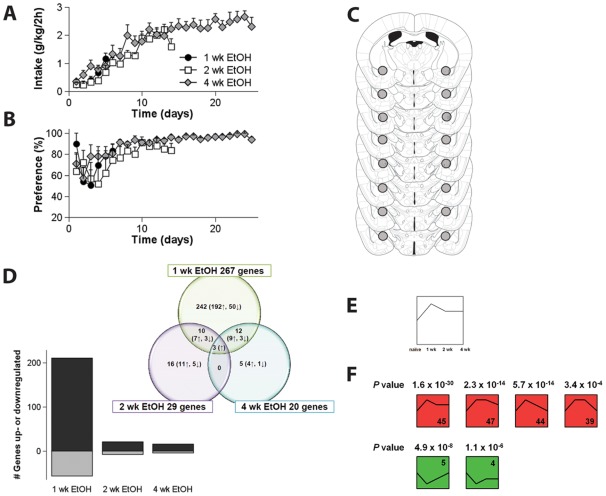
Figure 1. Alcohol intake and preference for C57BL/6J mice that consumed alcohol for 1, 2 or 4 weeks.
A The mice show a progressive increase in alcohol intake during the first two weeks of the experiment, stabilizing thereafter. B Preference for alcohol was high throughout the experiment. C RNA for microarray analysis was isolated from 0.6 mm diameter punches (○) from serial sections through the CeA. D The majority of the gene expression changes occurred after 1 week of alcohol consumption; the bar graph shows the total numbers of up- (black) and down-regulated (grey) genes for each time-point while the Venn Diagram shows the total number of up- and down-regulated genes (marked by arrows) for each time-point and overlap between the experimental groups. E–F Analysis of the microarray data using the Short Time Series Expression Miner (STEM), revealed significant gene enrichment particularly during the early stages of escalation of alcohol intake (week 1 and/or week 2). When considering all possible time profiles for gene expression after 1 wk, 2 wk and 4 wk of alcohol consumption, relative to data from naïve control mice (exemplified by E), 6 time profiles showed significant gene enrichment: they represented more genes than expected based on chance (F). The commonality between these 6 significant time profiles is that they all show an initial change in gene expression, normalizing thereafter to baseline levels.

