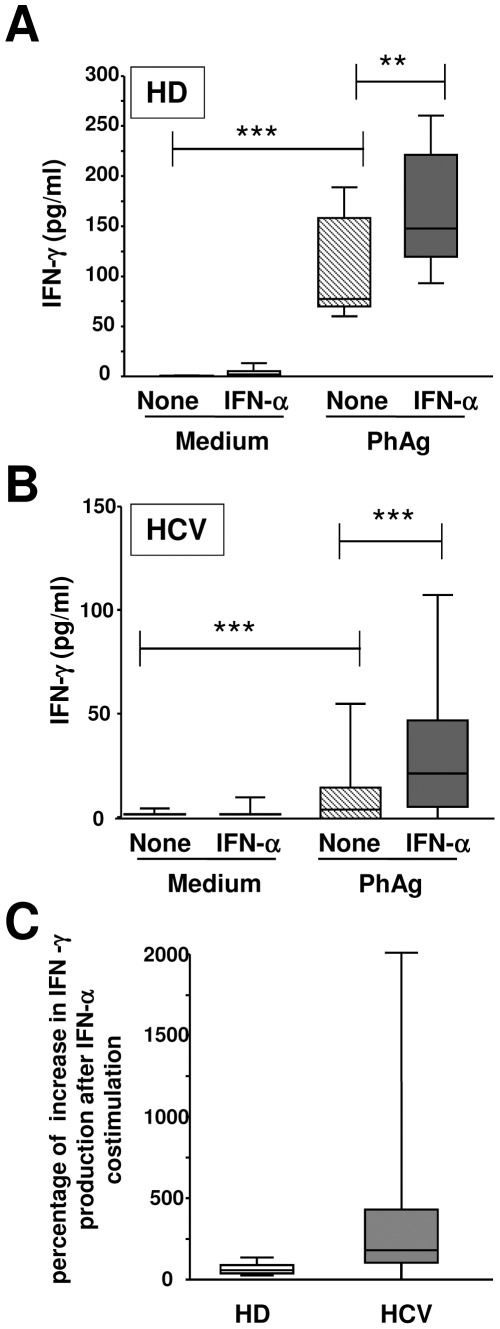
Figure 4. IFN-α improves in vitro PhAg-induced IFN-γ production of Vγ9Vδ2 T-cells in HCV patients.
(A,B) A quantitative analysis of IFN-γ production was performed in HD (n = 35, Panel A) and in HCV (n = 24, Panel B) by ELISA after medium (white boxes), IFN-α (grey boxes), PhAg (hatched boxes) and PhAg/IFN-α (dark grey boxes) stimulation. Statistical analysis was performed by Mann-Whitney test, **p<0.01 ***p<0.0001. (C) The percentage of increase in IFN-γ production after combined PhAg/IFN-α respect to single PhAg stimulation was compared between HD (white bar) and HCV patients (grey bar). Statistical analysis was performed by Mann-Whitney test, **p<0.01.

