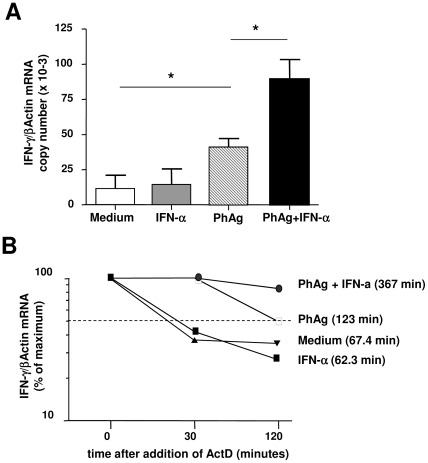
Figure 5. IFN-α and PhAg synergistically induce and stabilize IFN-γ-mRNA.
(A) IFN-γ-mRNA levels in purified Vγ9Vδ2 T-cells were evaluated by TaqMan qRT-PCR after 18 hours of medium (white bar), IFN-α (grey bar), PhAg (hatched bar), and PhAg/IFN-α (black bar) stimulation (n = 4). Statistical analysis was performed by Mann-Whitney test. *p<0.05. (B) IFN-γ-mRNA stability over time was measured by adding actinomycin-D to cultures after 18 hours of stimulation with medium (black triangles), IFN-α (black squares), PhAg (white squares), PhAg/IFN-α (black circles). The number of copies of IFN-γ-mRNA was normalized in respect to β-actin. Results from one representative donor are shown. Times in brackets represent mRNA half life evaluated by linear regression.

