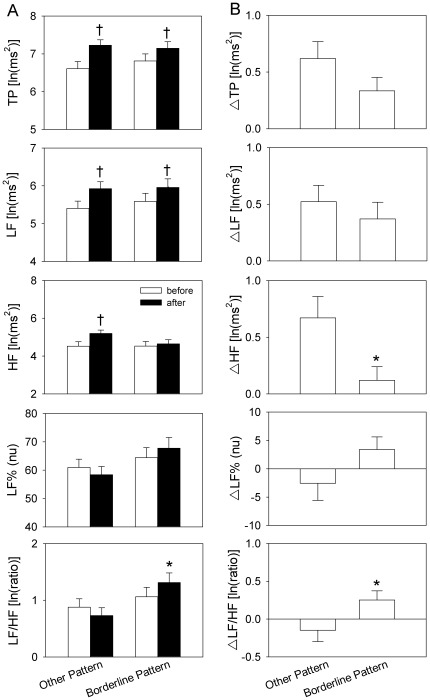
Figure 1. Comparison of heart rate variability (HRV) parameters before and after taking methadone.
(A) After methadone consumption, low frequency (LF) power and total power (TP) in the borderline pattern (BP) group and in the other patterns (OP) group are both elevated, while high frequency (HF) power only shows a significant elevation in OP group. Noticeably, the normalized LF (LF%) and LF/HF increase slightly after taking methadone among the BP group. (B) The HF and LF/HF are significantly different between the BP and OP groups. *p<0.05 vs. OP, †p<0.05 vs. before.

