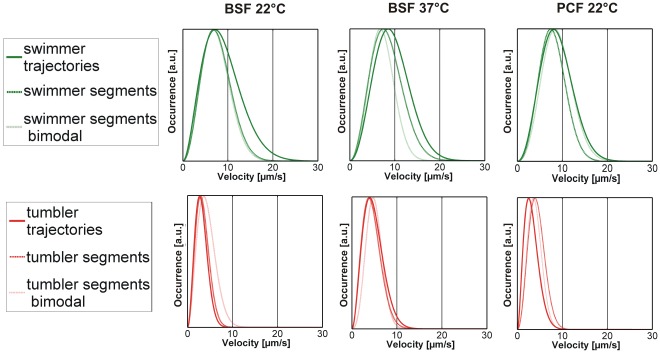
Figure 7. Comparison of the fitted velocity distributions for swimmer and tumbler trajectories.
The data for the pure swimmer and tumbler class are compared to the segmented data and to those trajectories which show a clear, “bimodal” switching manifested in the dip in the velocity histograms. The curves have been normalized to their maxima for better comparability.

