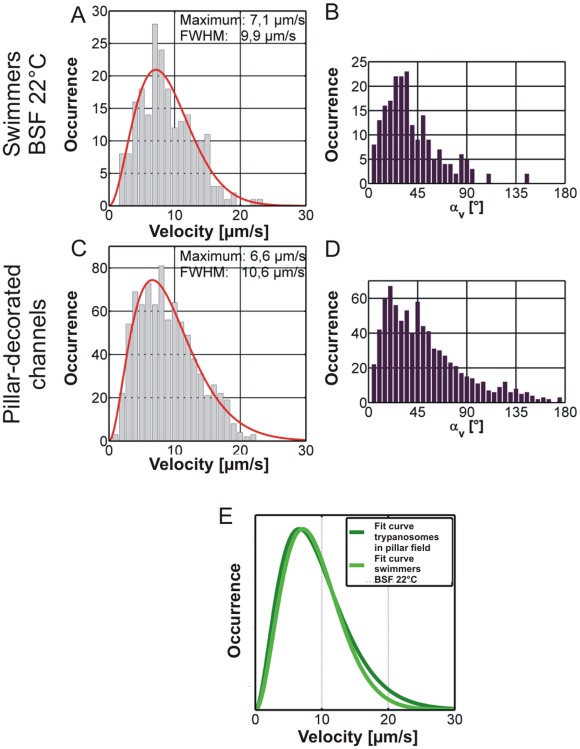
Figure 10. Comparison of swimming parameter distributions for swimmer class trajectories in unstructured channels and trajectories measured in the micropillar array.
Shown are the velocity (A and C) and swimming angle (B and D) distributions for swimmer class trajectories of BSF wildtype measurements in structured (C and D) and unstructured (A and B) channels. Panel E shows an overlay of the fitted curves for the velocity distributions of wildtype swimmer class and the ensemble velocity distribution for trypanosomes in pillar-decorated channels at 22°C. Curves in E were normalized to their maxima.

