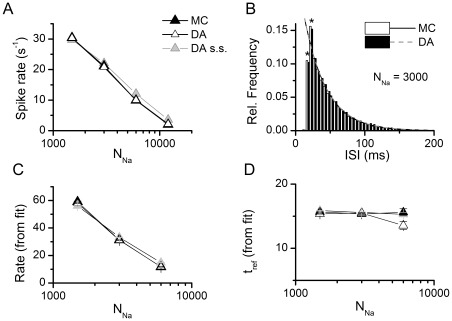
Figure 6. Firing rate and ISI distributions for the stochastic HH models. A.
Mean firing rate of the stochastic HH models in a 500 seconds simulation with different number of channels. Note that the symbols for DA and MC superimpose perfectly. B. An inter-spike interval (ISI) was built for each simulation and the data was fitted to an exponential decay function with a refractory period (see Methods and ref. [16]). The histograms for only two simulations are shown here for illustration purposes. The first two points (marked with asterisks) were omitted in the fitting procedure (see text). The fit lines for the two histograms showed here overlap almost perfectly. C–D. Fit parameters of the ISI distributions at different number of channels. In all the simulations, NK = 0.3×NNa. Data in this figure correspond to dt = 0.1 µs.

