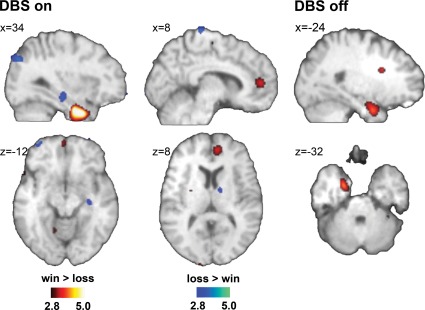
Figure 3. Comparisons win>loss and loss>win with active and inactive DBS.
Contrast images for the comparisons win>loss (color scale red/yellow) and loss>win (color scale blue/green) with active (left panel) and inactive (right panel) DBS in the target area. First level statistical analysis was performed with p<0.005 (uncorrected) and 50 voxel cluster threshold. Except for activation at the temporal pole no activation shown for the DBS on condition remained statistically significant when DBS was off.

