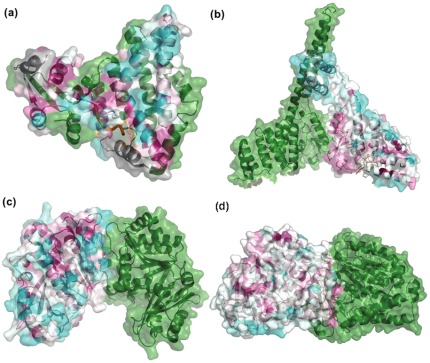
Figure 3. Homodimers exhibiting intrinsic global asymmetry.
This figure shows examples of intrinsically asymmetric homodimers. a). NSP3 homodimer (GloA_Sc – 8.57; PDB - 1knz) b). Carboxy terminus of Hsp70-interacting protein (CHIP) (GloA_Sc – 8.29; PDB - 2c2l) c). Cell division protein FtsZ (GloA_Sc – 10.33; PDB – 1rlu) d). Tubulin α and β subunits (GloA_Sc – 23.09; PDB – 1jff). One of the chains of the dimer is shown as a green colored cartoon whereas the other chain provides a color-based representation of the conservation of every residue position, calculated using ConSurf (refer Methods). In the chain colored based on ConSurf scores, highly conserved residues are colored magenta whereas poorly conserved residues are colored cyan and moderately conserved residues are shown in white. Any other ligand(s) if bound to the dimer is depicted in orange.

