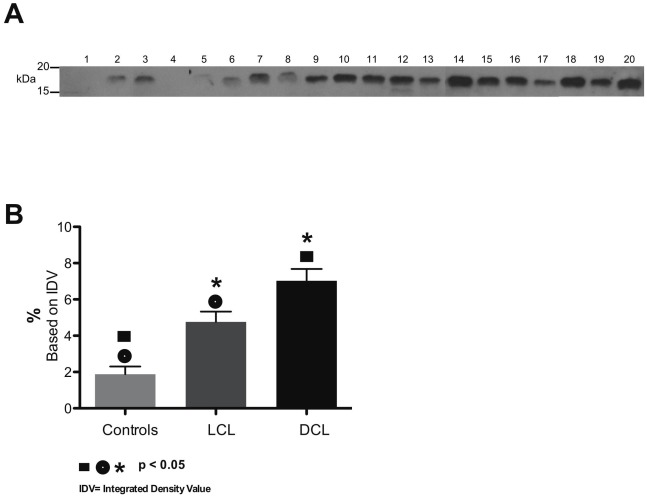
Figure 1. IL-1β expression in serum of patients with cutaneous leishmaniasis.
(A) Western blot of mature IL-1β (17 kDa) in 4 controls (1–4), 9 LCL patients (5–13) and 7 DCL patients (14–20). (B) Graph of percentage intensity of IL-1β bands with statistically significant differences between controls vs LCL patients, controls vs DCL patients and LCL vs DCL patients. (Identical symbols above different bars are statistically significant: p<0.05).

