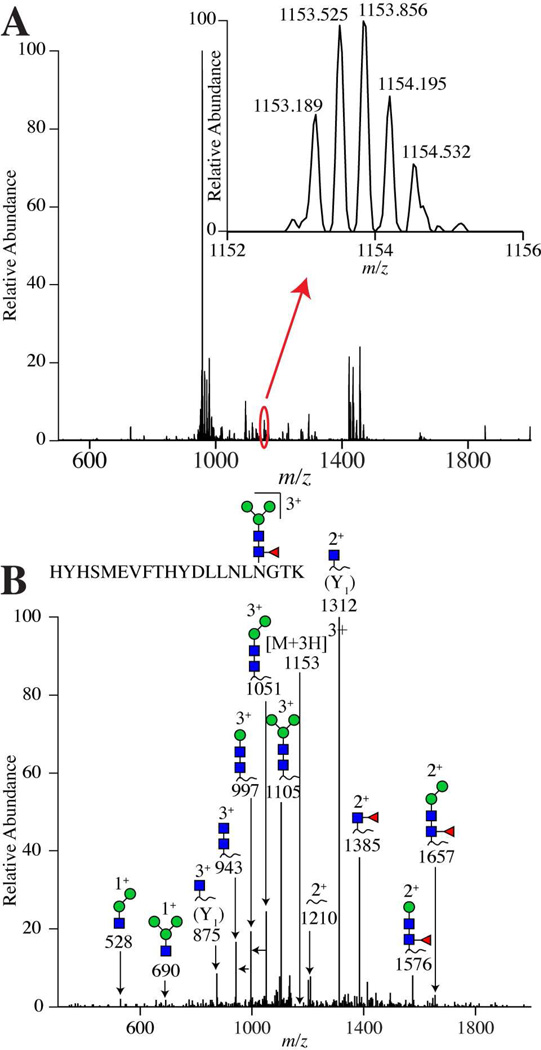
Figure 3.
(A) High resolution mass spectrum from hLOXL2 from the retention time 38–39 min. The peak circled in red illustrates where the hLOXL2 glycopeptide ion in (B) is located in the spectrum and the zoomed in region shows the isotopic distribution for the hLOXL2 glycopeptide ion, where the mass error can be calculated from the monoisotopic m/z value. (B) hLOXL2 glycopeptide MS/MS data at m/z 1153. The blue squares are N-acetylhexosamine, green circles are hexose, and the red triangle is fucose. The MS/MS data show losses of glycan residues that aid in determining the glycan composition.

