Figure 7.
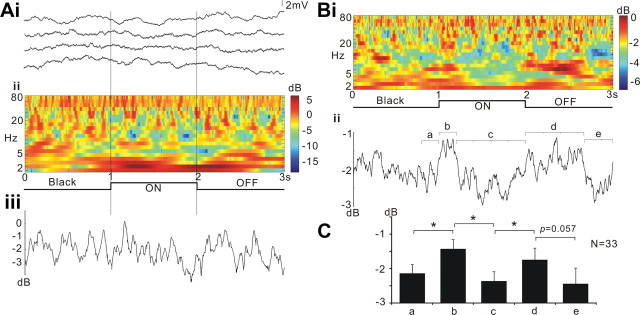
L1CNs respond to slow flicker. A, Responses of a single L1CN. Ai, Membrane potential recordings in four successive trials. Aii, Time–frequency plot showing the power of membrane potential oscillations during the stimulus, averaged from the four trials shown in Ai. Aiii, Line plot showing averaged powers (2–80 Hz) throughout the stimulus calculated from the time–frequency plot of Aii. This L1CN showed weak response to slow flicker. B, Time–frequency plot of averaged response from grouped L1CNs (N = 33). Letters indicate time windows where the averaged powers were statistically compared (Bii: a, b, 200 ms; c, 800 ms; d, 700 ms; e, 300 ms). C, Averaged decibel power at various time windows during the stimulus (mean ± SEM). Both light ON and light OFF initiate significantly increased power of membrane potential fluctuations. *p ≤ 0.05.

