Figure 8.
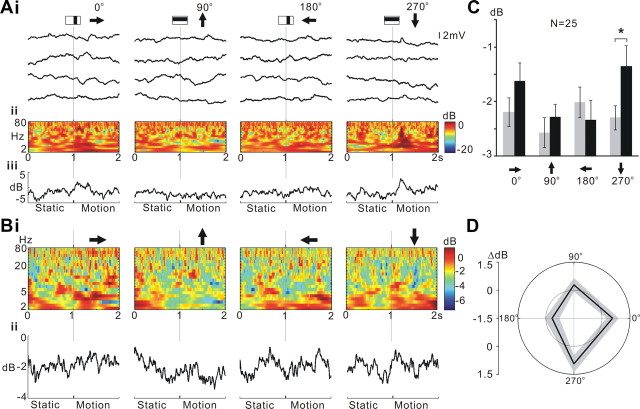
L1CNs respond selectively to a single bar moving in a downward direction. A, Responses to single-bar motion of an individual L1CN. Ai, Sample recordings in four successive trials for each stimulus direction. Aii, Time–frequency plots during the stimulus averaged from each of the four sets of trials shown in Ai. Aiii, Line plots showing the mean power (2–80 Hz) change throughout the stimulus for each stimulus direction. B, Time–frequency plot of averaged responses from grouped LCNs (N = 25) for each direction. Bii, Line plots show the averaged power (2–80 Hz) change throughout the stimulus calculated from the time–frequency plots in Bi. Arrows, Direction of the motion pattern with respect to the head of the fly. C, Mean power during 200 ms before (gray bar) and after (black bar) motion stimulus onset for different directions (mean ± SEM). Downward (270°) motion initiated a significant response (p ≤ 0.05). D, Polar plots of mean power difference between 200 ms before and after motion stimulus onset for different directions. Gray area, Mean ± SEM; inner dotted line, zero power change.

