
Figure 2.
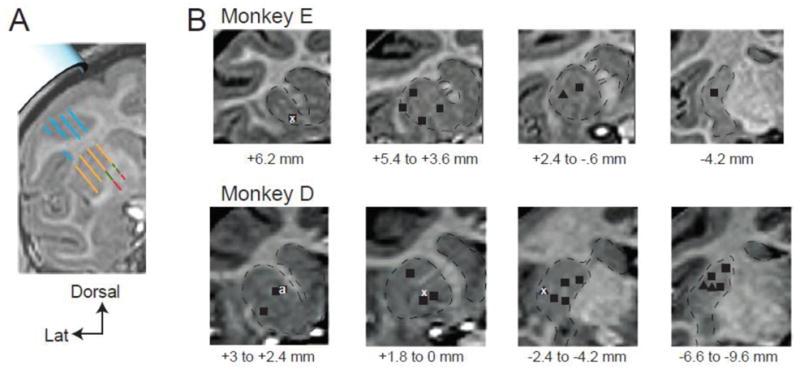
Anatomic localization of injection locations using microelectrode mapping and structural MRI. A) Representative coronal plane of MRI and corresponding microelectrode mapping results. Sites along parallel recording tracks are color-coded based on the characteristic neurophysiologic activity observed at those locations (blue = cortex, orange = striatum, green = external globus pallidus, red = internal globus pallidus). Estimation of the exact position of the implanted recording chamber (light blue cylinder, upper left) relative to the striatum was determined by finding the best fit between microelectrode mapping results and MRI-defined structural landmarks integrated across multiple coronal planes (not shown). As seen for this exemplar plane, microelectrode mapping results aligned very well with structural boundaries visible in the animal’s MRI. B) Localization of injection sites. Mapping-based alignment of the recording chamber with an animal’s MRI allowed estimation of intracerebral location of injections. For monkey E and monkey D, each injection site is marked by a black square (cis-flu), black triangle (cis-flu into microexcitable arm area of the putamen) or white x (saline). Injection sites are collapsed across coronal slices (≤ 3 mm per section). The distance ranges below each figure represent the AP planes collapsed into that figure (in mm relative to the anterior commissure). For monkey D, injection sites from right and left hemispheres are collapsed onto one hemisphere.