
Figure 3.
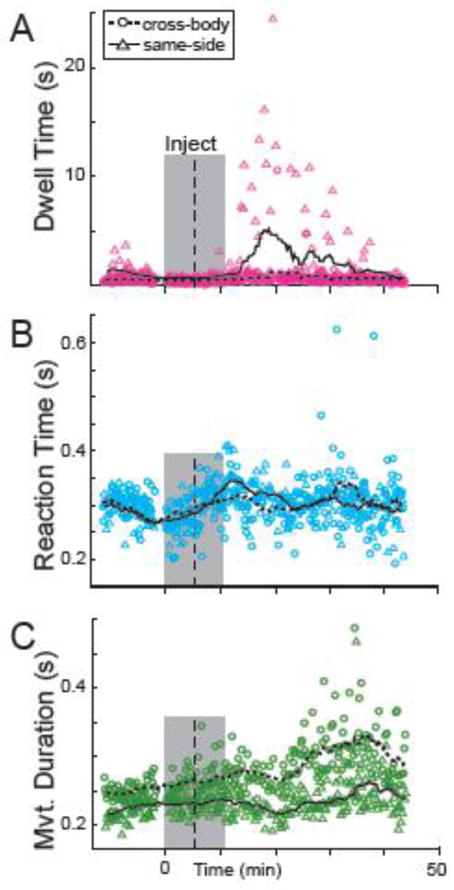
Exemplar data from one cis-flu injection experiment. Dwell times at the peripheral target (DTs) were prolonged markedly following this injection (A) while reaction times (RTs; B) and movement durations (MDs, C) showed smaller changes. During this experiment, the animal performed the task with the left arm only (contralateral to the infusion site). Data points represent the DTs (pink), RTs (blue), and MDs (green) of individual trials. Circles and triangles denote data from reaches to cross-body (right) and same-side (left) targets. Shaded box: period during which cis-flu was injected. Vertical dashed line: delineation between “pre-“ and “post-injection” periods used for all behavioral analyses. Dotted and continuous lines: moving averages (20 trials of the same trial type) for cross-body and same-side reaches, respectively.