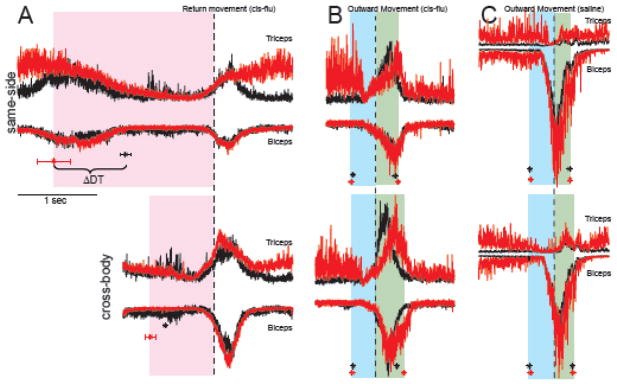
Figure 4.
Peri-event EMG activity from one cis-flu injection (same experiment as in Fig. 3). A) Mean “peri-return” EMG activity (mean rectified EMG averaged around the onsets of return movements) during pre- (black) and post- (red) injection periods. There was no evidence of increased co-contraction or loss of muscle tone to explain the lengthened DTs of the post-injection period. ΔDT: Difference in mean DTs from pre- and post-injection periods (black and red asterisks, respectively). Triceps EMG was elevated post-injection during the start position hold period, i.e., following return movements (A) and before outward movements (B). B) Mean EMG averaged around onsets of outward movements before (black) and after (red) the cis-flu injection. The peri-movement burst of triceps EMG showed a slowed rate of rise following the injection, particularly for cross-body movements (bottom row). Data in B were taken from the 20-trial epoch during which a maximal increase in MDs was observed. C) Peri-movement EMG activity before (black) and after (red) a saline infusion. Asterisks and horizontal error bars indicate means ± SEMs for DTs (panel A), and RTs and MDs (panels B and C). Shaded boxes indicate mean post-injection DT (pink), RT (blue) and MD (green). These EMG data were from the same cis-flu injection day as illustrated in Figure 3.

