
Figure 6.
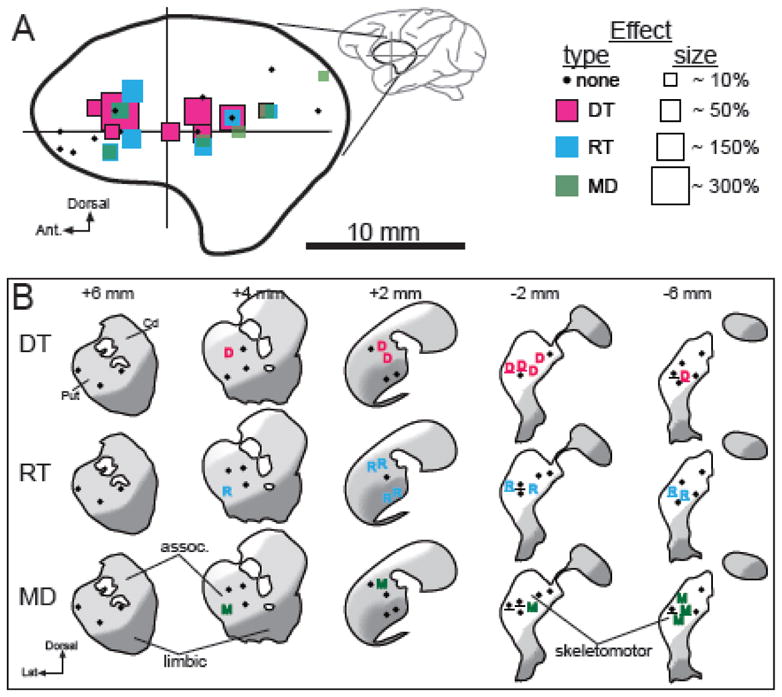
Anatomical reconstruction of injection sites and their effects. A) Each injection site is represented by a square color-coded by the type of impairment elicited and scaled in size according to the severity of the effect. Results are collapsed across the sagittal plane. Boundaries of the putamen in sagittal view (thick line) were taken from Francois et al. (1996). Crossed lines indicate the position of the anterior commissure. B) The locations of significant DT, RT, and MD effects are plotted onto standard coronal planes of the striatum adapted from (Martin and Bowden, 1996). Black dots: injection sites that elicited no effect. Underlines: injections performed at sites in the putamen where microstimulation evoked movement of the arm. Distances (top) indicate distance of each coronal plane anterior (+) or posterior (−) to the anterior commissure. Cd = caudate and Put = putamen. Approximate locations of the general skeletomotor, associative, and limbic functional territories of the striatum are indicated by white, light gray, and dark gray shading, respectively (see Methods).