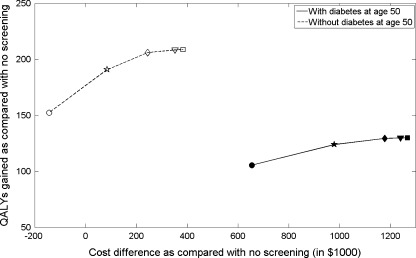
Figure 1.
Cost difference versus QALYs gained as compared with no-screening for different CRC screening cessation strategies per 1,000 individuals, with and without diabetes at age 50 (circle: screening cessation after age 50; pentagram: age 60; diamond: age 70; triangle: age 80; and square: no stop age).

