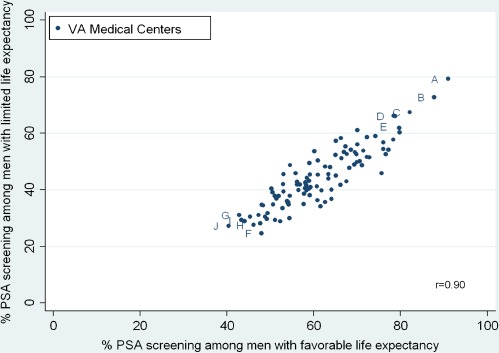
Figure 3.
Correlation of PSA screening among older men with favorable and limited life expectancies at each of 104 VAs. Favorable life expectancy defined as men aged 70–79 with Charlson score = 0 (life expectancy >10 years). Limited life expectancy defined as men aged 85+ with Charlson score ≥1 or men aged 70+ with Charlson score ≥4 (life expectancy ≤5 years). Letters correspond to the highest and lowest screening VAs from Figure 2. The lower right quadrant is where screening is best targeted according to life expectancy (i.e., low screening in men with limited life expectancy and high screening in men with favorable life expectancy).

