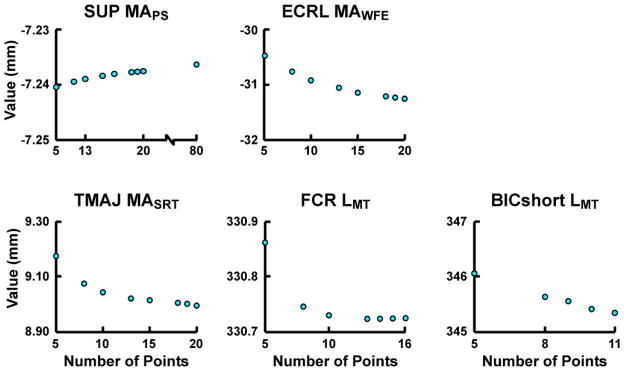
Figure 3.
Example results from the sensitivity analysis used to determine the influence of mesh size on the regression equation values. Each panel represents the value corresponding to a single point in the joint space when calculated from a regression equation developed from increasing the mesh size. Panels show equations dependent on different generalized coordinates: SUP MAPS – 1 coordinate, ECRL MAWFE – 2 coordinates, TMAJ MASRT – 3 coordinates, FCR LMT – 4 coordinates and BICshort LMT – 5 coordinates. All regression equations followed similar trends.

