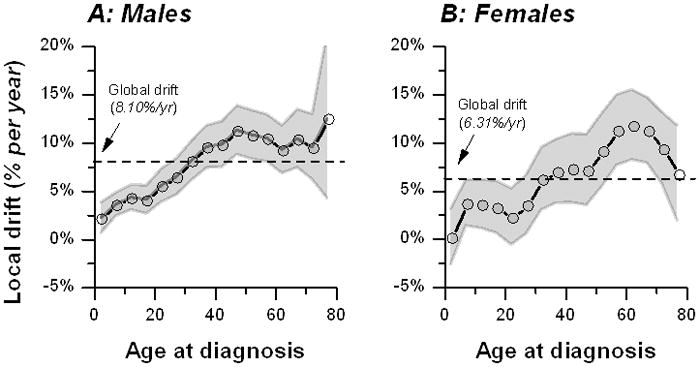
Figure 3.

Fitted local drifts (circles connected by a dotted line) for males (Panel A) and females (Panel B) during 1978 through 2002, based on data reported in Cancer Incidence in Five Continents Volumes V to IX. The local drifts are bounded by 95% confidence bands. The dotted line depicts the global drift for all ages combined. Conceptually, local drifts are similar, but not numerically equivalent, to the estimated age-specific annual percentage change of the ASR (see methods).
