Abstract
Children of Alzheimer's Disease (AD) patients are at heightened risk of developing AD due to genetic influences, including the apolipoprotein E4 (ApoE4) allele. In this study, we assessed the earliest cortical changes associated with AD in 71 cognitively healthy, adult children of AD patients (AD offspring) as compared with 69 with no family history of AD (non-AD offspring). Cortical thickness measures were obtained using FreeSurfer from 1.5T magnetic resonance (MR) scans. ApoE genotyping was obtained. Primary analyses examined family history and ApoeE4 effects on cortical thickness. Secondary analyses examined age effects within groups. All comparisons were adjusted using False Discovery Rate at a significance threshold of p < 0.05. There were no statistically significant differences between family history and ApoE4 groups. Within AD offspring, increasing age was related to reduced cortical thickness (atrophy) over large areas of the precuneus, superior frontal and superior temporal gyri, starting at around age 60. Further, these patterns existed within female and maternal AD offspring, but were absent in male and paternal AD offspring. Within non-AD offspring, negative correlations existed over small regions of the superior temporal, insula and lingual cortices. These results suggest that as AD offspring age, cortical atrophy is more prominent, particularly if the parent with AD is mother or if the AD offspring is female.
Keywords: Antecedent biomarker, Familial risk, Alzheimer’s Disease, Dementia, Adult Children Study, Cortical thickness, Maternal risk
INTRODUCTION
Alzheimer disease (AD) is a neurodegenerative disorder in which neurochemical and neuroanatomical changes precede clinical symptoms. The risk for developing AD is influenced by family history (children of AD patients are 6 times more likely to develop AD as compared with those without a family history (Bendlin et al., 2010)) and ApoE4 (Debette et al., 2009, Fleisher et al., 2009) (which alters amyloid-beta protein metabolism (Bu, 2009)). Increased risk of developing AD has also been found in postmenopausal women when compared to elderly males (Janicki and Schupf, 2010), perhaps due to lack of estrogen’s neuroprotective effects, as well as in individuals with a maternal family history of AD when compared to individuals with a paternal family history (Edland et al., 1996, Gomez-Tortosa et al., 2007).
The use of neuroimaging measures as biomarkers of antecedent AD in its pre-symptomatic stages has been shown to be both promising and challenging. For example, beta amyloid deposition and glucose metabolism in the brain can be detected by amyloid imaging (Pike et al., 2007) but this method is very invasive and expensive, while hippocampal volume loss is barely detectable in structural magnetic resonance imaging (MRI), a minimally non-invasive and relatively inexpensive approach (Aisen et al., 2010). Encouragingly, abnormal values of these antecedent biomarkers have been found in individuals with elevated risk for developing AD, i.e., women, carriers of apolipoprotein E4 (ApoE4) allele, and individuals with a family history of AD, especially maternal history (Bendlin et al., 2010, Gomez-Tortosa et al., 2007, Lautenschlager et al., 1996, Payami et al., 1996, Sager, Hermann, and La Rue, 2005, Wu et al., 1998).
The goal of the current study was to use structural MRI to determine whether cortical atrophy patterns that are characteristic of AD existed in individuals at familial risk for AD. We compared cortical thickness measures between cognitively healthy, middle-aged adults who have an AD parent with cognitively healthy, middle-aged adults who do not have a family history of AD. We also examined the relationship of cortical thickness measures with age and other factors that may be related to cortical thinning, such as the presence of an ApoE4 allele, being female and having a mother with AD.
METHODS
Subjects
One hundred and forty (140) cognitively normal participants from the Adult Children Study from the Knight Alzheimer's Disease Research Center (ADRC) at Washington University in St. Louis were included in this study. Seventy-one (71) participants had at least one biological parent with clinical AD (i.e., AD offspring) and 69 had none (i.e., non-AD offspring). In addition, ApoE4 allele status was obtained in all participants.
MRI Acquisition Parameters and Processing
MR scans were acquired on a 3 Tesla Siemens Trio scanner (Siemens Medical Systems). Scanning protocol included the collection of multiple (2–4) high resolution, 3D T1-weighted MPRAGE sequence volumes (TR: 9.7 ms, TE: 4.0 ms, flip angle: 10°, scan time: 6.5 mins per acquisition, voxel resolution: 1 mm × 1 mm × 1.25 mm). The multiple scans for each subject were registered with its first scan and averaged to form a low-noise volume (Buckner et al., 2004).
MRI data were processed using FreeSurfer 4.1.0 (http://surfer.nmr.mgh.harvard.edu). A white matter surface was generated through tessellation of the gray/white junction, which was deformed and inflated outwards to approximate the gray-CSF boundary. Any geometric inaccuracies or topological defects were corrected using a combination of automatic and manual methods. Manual editing was conducted by a trained rater (KR). A 15-mm FWHM kernel was applied to the cortical thickness data along the cortical surface. Cortical thickness maps were generated on the inflated surface for visualization purposes.
Statistical Analysis
We first compared cortical thickness to examine the effects of family history and ApoE4 allele status, using age as a covariate (age difference was significant, see below). We then examined relationships between cortical thickness and age separately in each of the following: offspring group, gender of affected children, and gender of the AD parent (participants with both parents diagnosed with AD were excluded from the last comparison). All statistical maps (group comparison as well as correlation) were generated using general linear models on cortical thickness data at each surface vertex. Significance values were adjusted for multiple comparisons using False Discovery Rate threshold of p < 0.05 and visualized on the surface as −log(10)p.
RESULTS
Subjects
The mean (SD) age for AD-offspring was 59.86 (8.71) years. The mean (SD) age for non-AD offspring was 63.06 (8.19) years. The difference in age between these two groups was significant (p=0.027). Thirty-seven AD offspring and 21 non-AD offspring had at least one ApoE4 allele (chi-square= 5.9, p=0.015). See Table 1 for demographics details and ApoE genotyping distributions.
Table 1. Demographic Characteristics of Participants.
T-test or chi-square test were used where appropriate.
| Characteristic | AD offspring | Non-AD offspring | P-value |
|---|---|---|---|
| Mean (SD) [Range] | Mean (SD) [Range] | ||
| Age | 59.86 (8.71) [45.19–76.42] | 63.06 (8.19) [45.87–74.98] | 0.027 |
| N | 71 | 69 | |
| Male/Female | 13/58 | 20/49 | 0.20 |
| Paternal/Maternal | 19/52 | - | |
| ApoeE4+/− | 37/34 | 21/48 | 0.015 |
| ApoE Genotype | |||
| 22 | 1 | 2 | - |
| 23 | 6 | 4 | - |
| 24 | 4 | 3 | - |
| 33 | 27 | 42 | - |
| 34 | 30 | 15 | - |
| 44 | 3 | 3 | - |
Family History
Comparisons between AD offspring and non-AD offspring did not yield statistically significant differences in cortical thickness. When we grouped subjects into 3 decade age-segments (i.e., 45–54, 55–64, 65 and above), there were no difference in cortical thickness between these two groups within any of the age segments.
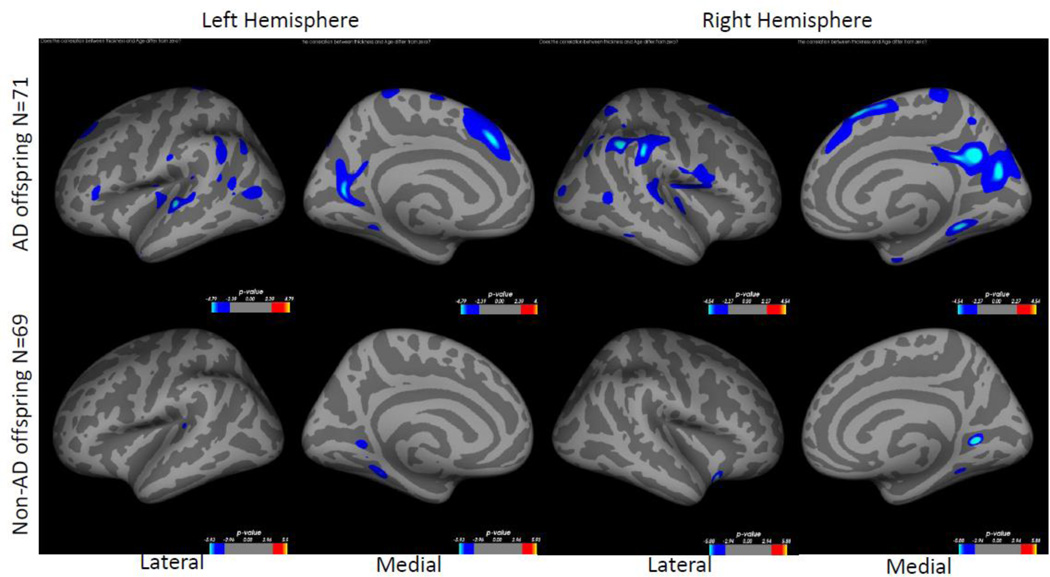
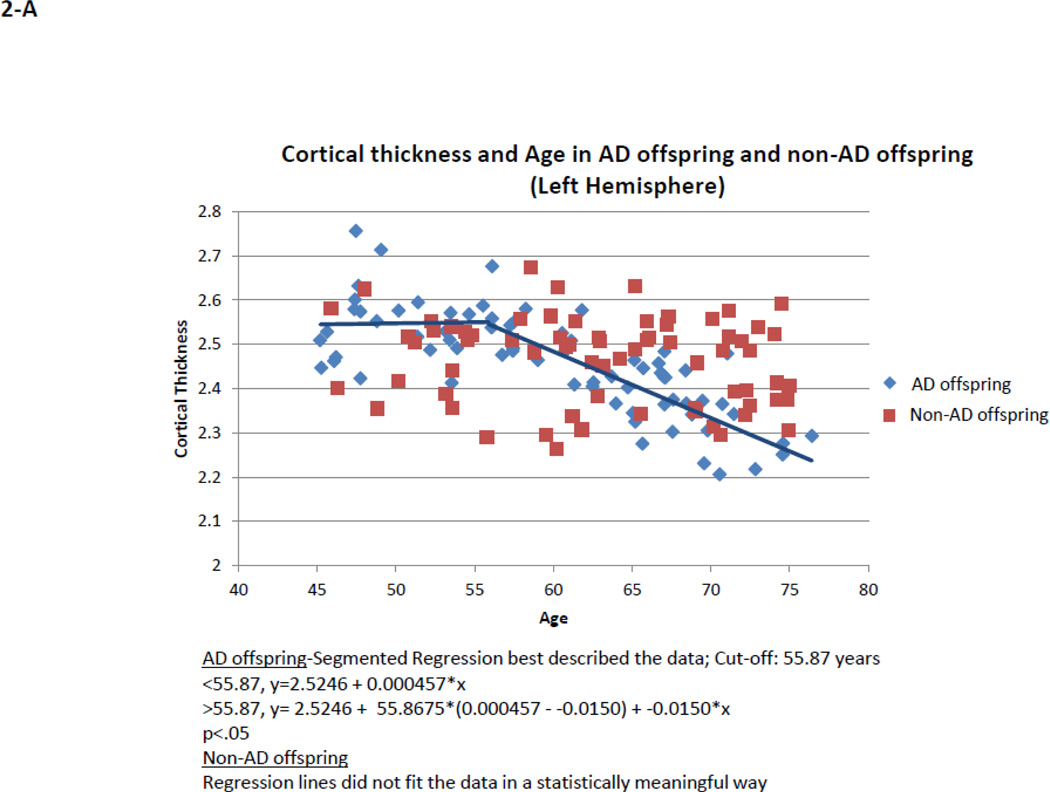
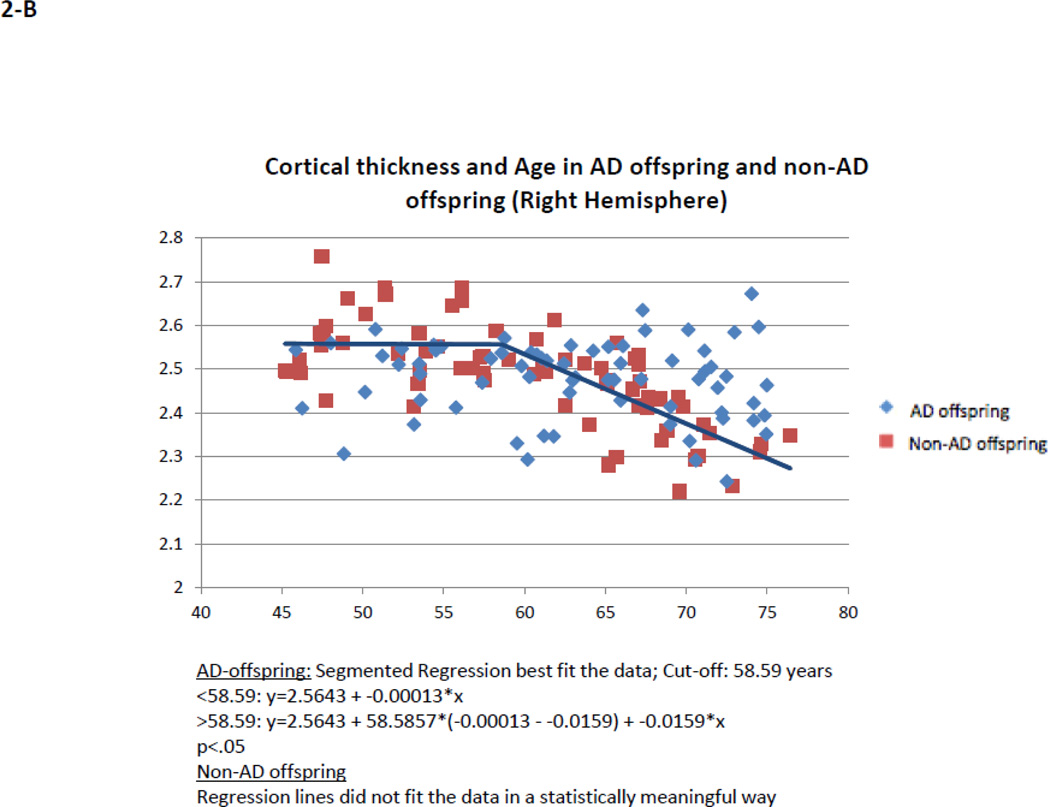
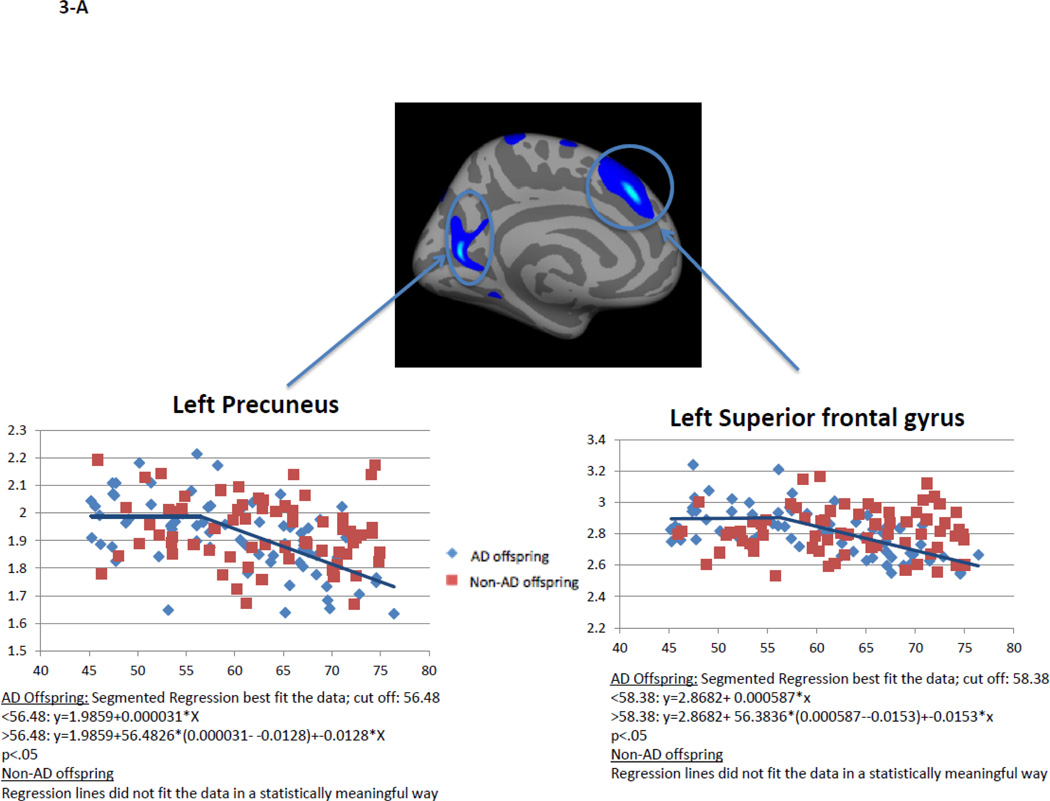
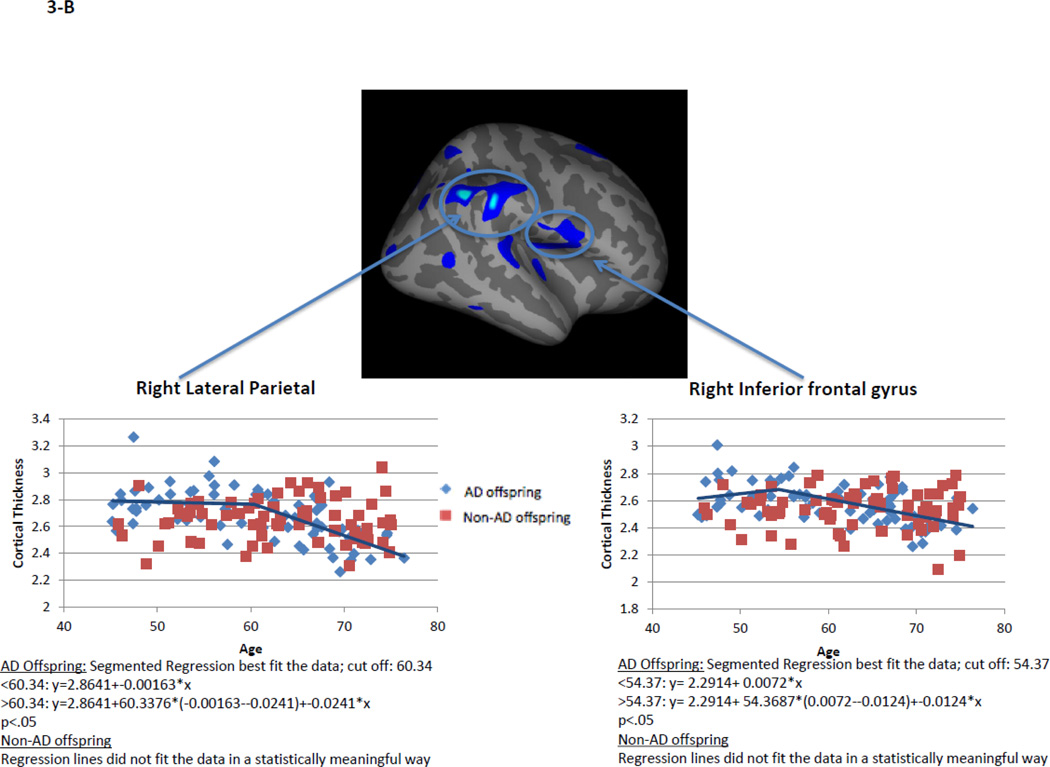
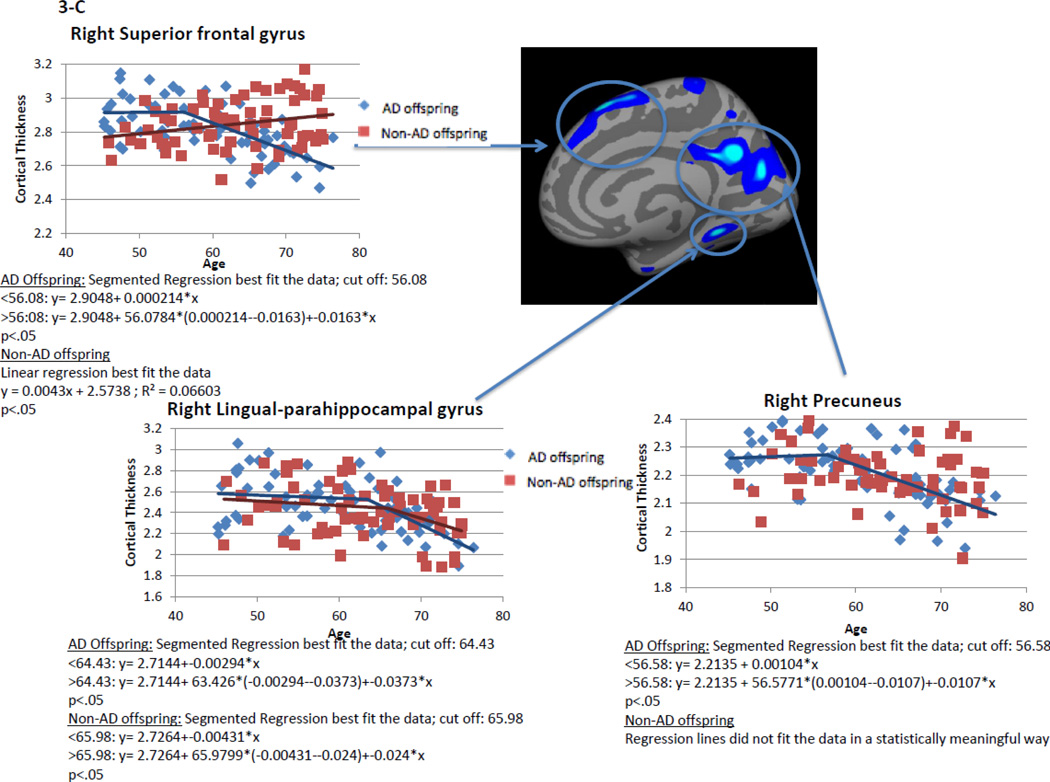
Within AD offspring, correlations between cortical thickness and age yielded large regions of statistically significant negative correlations, most prominent in the precuneus, superior frontal gyrus and superior temporal gyrus in both hemispheres, as well as isthmus cingulate, superior parietal, inferior frontal, supramarginal, insula, middle temporal, inferior temporal, fusiform gyrus, entorhinal and lateral occipital cortices (Figure 1, top row). Within non-AD offspring, age-related cortical thinning was observed in small and scattered regions of the lingual, fusiform and insular cortices (Figure 1, bottom row). Across the large areas observed in the AD offspring we calculated a mean thickness value for every participant and found a statistically significant piecewise linear relationship between cortical thickness values and age in the AD offspring (left hemisphere: breakpoint = 55.9 years, annual change before breakpoint = 0.0 mm/year, annual change after breakpoint = −0.015 mm/year; right hemisphere: breakpoint = 58.6 years, annual change before breakpoint = 0.0 mm/year, annual change after breakpoint = −0.016 mm/year)) but not for the non-AD off spring (Figure 2, Table 2). We also calculated mean thickness values in each of the above areas for every participant: left precuneus, left superior frontal gyrus, right lateral parietal cortex, right inferior frontal gyrus, right superior frontal gyrus, and right precuneus. In all but one area we found a statistically significant piecewise linear relationship between cortical thickness values and age within the AD offspring but not for the non-AD offspring (Figure 3). In the right ligual – parahippocampal gyrus, both AD offspring and non-AD offspring showed a statistically significant piecewise linear relationship between cortical thickness values and age (Figure 3 C, middle panel). The average breakpoint across individual ROIs is 58.1 (+/−3.3) years, the average annual change before breakpoint is 0.0 mm/year, and the average annual change after breakpoint is −0.018 (+/− 0.0093) mm/year. A complete list of the linear and piecewise linear fits for all regions can be found in Table 2.
Figure 1. Correlation between cortical thickness and age in AD offspring and in non-AD offspring.
Colored regions represent areas of statistical significance shown as −log10(p) with FDR correction of 0.05. Blue regions indicate a negative correlation and red regions indicate a positive correlation. Top row shows AD offspring, bottom row shows non-AD offspring. Left two columns are the left hemisphere and the right two columns are the right hemisphere. Columns 1 and 3 show the lateral side and columns 2 and 4 show the medial side.
Figure 2. Quadratic correlation (inverted U) between mean cortical thickness and age across the entire cortical surface.
AD offspring show a steady rate of decline beginning at age 60. Non-AD offspring do not show a strong trend of cortical thinning.
Table 2. Parameters for all regions with linear or piecewise linear fits.
For individual ROIs (i.e., excluding whole hemispheres), the average age of breakpoint for the piecewise linear regression models for AD offspring is 58.1 (+/−3.3) years, the average annual change before breakpoint = 0.0 mm/year, and the average annual change after breakpoint = −0.018 (+/−0.0093) mm/year.
| ROI | AD offspring | Non-AD offspring | ||||
|---|---|---|---|---|---|---|
| Annual change before breakpoint (mm/year) |
Breakpoint (age, year) |
Annual change after breakpoint (mm/year) |
Annual change before breakpoint (mm/year) |
Breakpoint (age, year) |
Annual change after breakpoint (mm/year) |
|
| All LH regions | 0.0 | 55.9 | −0.015 | NS | ||
| All RH regions | 0.0 | 58.6 | −0.016 | NS | ||
| LH precuneus | 0.0 | 56.5 | −0.013 | NS | ||
| LH superior frontal gyrus | 0.0 | 58.4 | −0.015 | NS | ||
| RH lateral parietal | 0.0 | 60.3 | −0.024 | NS | ||
| RH inferior frontal gyrus | 0.0 | 54.4 | −0.012 | NS | ||
| RH superior frontal gyrus | 0.0 | 56.1 | −0.016 | 0.0 (linear) | ||
| RH lingual-parahippocampal gyrus | 0.0 | 64.4 | −0.037 | 0.0 | 66.0 | −0.024 |
| RH precuneus | 0.0 | 56.6 | −0.011 | NS | ||
Figure 3. Linear and piecewise linear regression relationships between mean cortical thickness and age across specific areas of the cortical surface: A – left precuneus, left superior frontal gyrus; B – right lateral parietal cortex, right inferior frontal gyrus; B – right superior frontal gyrus, right ligual – parahippocampal gyrus, and right precuneus.
AD offspring show a steady rate of decline across all areas beginning at age around 60. Non-AD offspring do not show a strong trend of age-related cortical thinning, excluding the lingual-parahippocampal gyrus.
APOE4
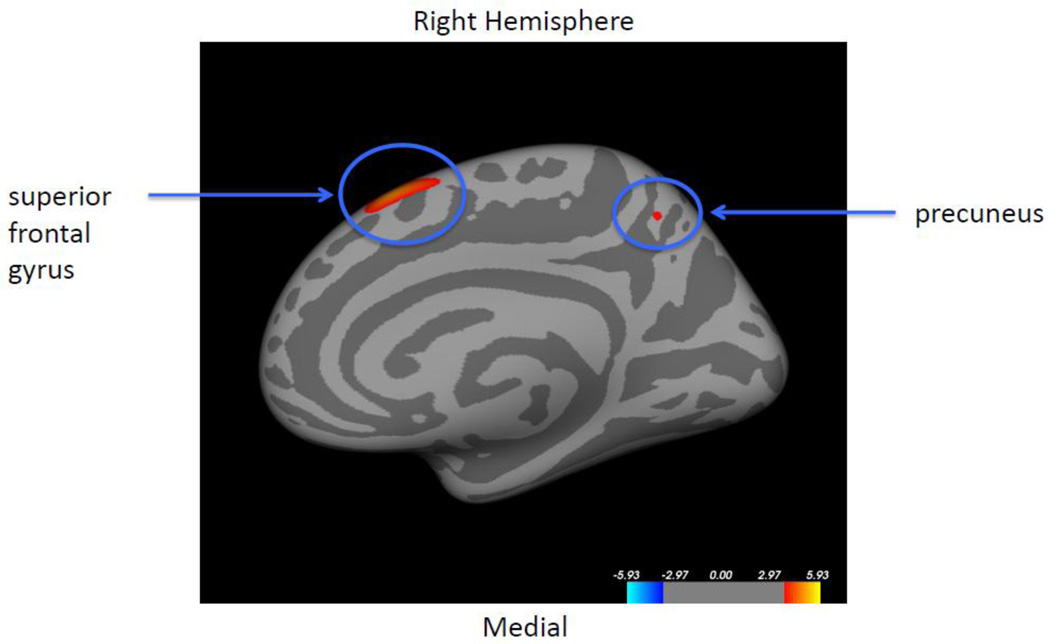
Comparisons between e4+ and e4− participants did not yield statistically significant differences in cortical thickness, nor was there an APOE4-status-by-family history interaction. When we grouped subjects into 3 decade age-segments (i.e., 45–54, 55–64, 65 and above), there were no APOE4 effect or APOE4-by-famiy history interaction in cortical thickness within any of the age segments. Correlations between cortical thickness and age were not statistically significant within either e4+, e4− groups, e4+ AD offspring, or e4+ non-AD offspring. When controlling for APOE4 status, the AD offspring showed greater age-related cortical thinning in the right superior frontal gyrus and the right precuneus than the non-AD offspring (Figure 6).
Figure 6. Correlation between cortical thickness and age, controlling for ApoE4 status.
Colored regions represent areas showing statistically significant differences in thickness-age correlation, between AD offspring and non-AD offspring, controlling for ApoE4 status. Statistical significance is shown as −log10(p) with FDR correction of 0.05. After controlling for ApoE4 status, the AD offspring showed more age-related cortical thinning than the non-AD offspring in the superior frontal gyrus and the precuneus of the right hemisphere (red regions). There were no other areas of significant thickness-age interaction in either hemisphere.
Gender of AD Offspring and Gender of AD Parent
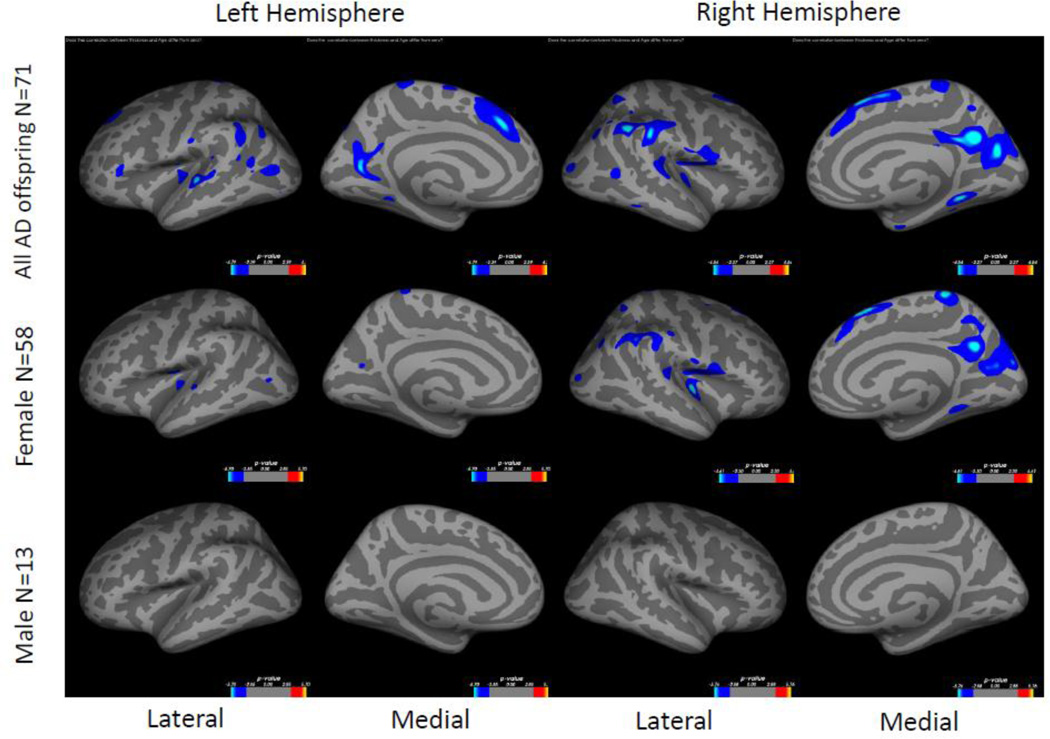
There were no statistically significant differences in cortical thickness between female AD offspring and male AD offspring. Within the female AD offspring, increasing age was significantly related to decreasing cortical thickness in small regions of the superior temporal gyrus, insula and precuneus on the left hemisphere and in pronounced regions of the insula, supramarginal, precuneus and superior frontal gyrus on the right hemisphere (Figure 4, middle row), similar to the pattern that was observed in the AD offspring as a whole (Figure 1 or Figure 4, top row). No significant relationship was found within the male AD offspring (Figure 4, bottom row). When controlling for gender, the AD offspring and the non-AD offspring did not show differences in age-related cortical thinning anywhere on the hemisphere surfaces.
Figure 4. Correlation between cortical thickness and age in female and male AD offspring.
Colored regions represent areas of statistical significance shown as −log10(p) with FDR correction of 0.05. Blue regions indicate a negative correlation and red regions indicate a positive correlation. Top row shows all AD offspring (same as Figure 1, top row), middle row shows female AD offspring, and bottom row shows male AD offspring. Left two columns are the left hemisphere and the right two columns are the right hemisphere. Columns 1 and 3 show the lateral side and columns 2 and 4 show the medial side.
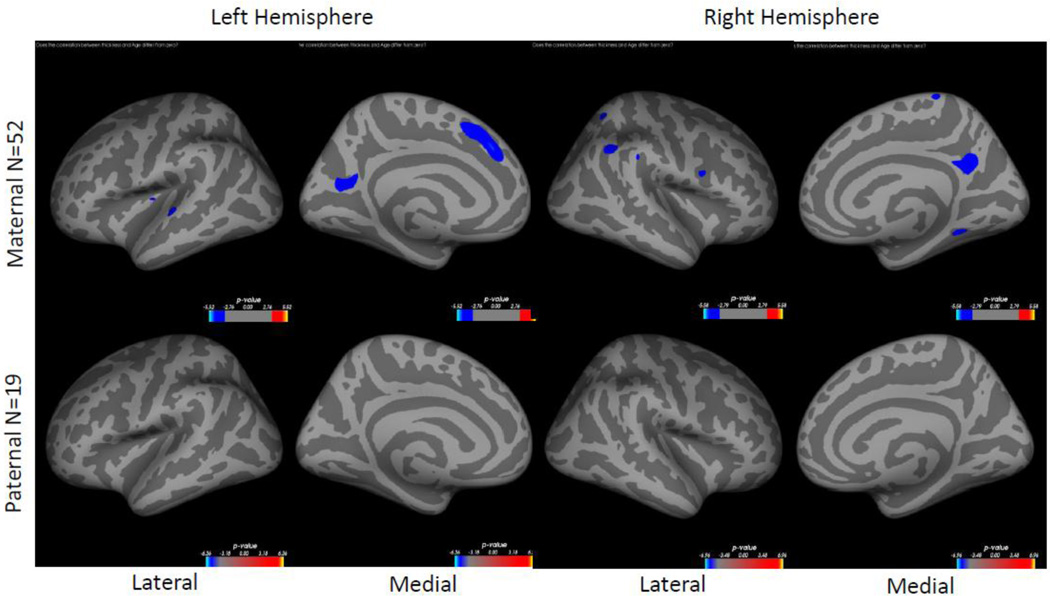
There were no statistically significant differences in cortical thickness between AD offspring with a maternal history vs. AD offspring with a paternal history. Within the maternal AD offspring, increasing age was significantly related to decreasing cortical thickness mostly in bilateral precuneus, superior frontal gyrus on the left hemisphere and supramarginal gyrus on the right hemisphere (Figure 5, top row). No significant relationship was found within the paternal history AD offspring (Figure 5, bottom row).
Figure 5. Correlation between cortical thickness and age in maternal and paternal AD offspring.
Colored regions represent areas of statistical significance shown as −log10(p) with FDR correction of 0.05. Blue regions indicate a negative correlation and red regions indicate a positive correlation. Top row shows maternal AD offspring, bottom row shows paternal AD offspring. Left two columns are the left hemisphere and the right two columns are the right hemisphere. Columns 1 and 3 show the lateral side and columns 2 and 4 show the medial side. Participants with both paternal and maternal heritability were excluded from this comparison.
DISCUSSIONS
Children of AD patients are at elevated risk for developing AD. However, antecedent biomarkers for this risk have not been well defined. Additionally, the age at which these biomarkers change is yet to be determined. The goal of this study was to determine if age-related cortical thinning patterns as such an antecedent biomarker could be explained by family history of AD. In cognitively normal, middle-aged individuals we compared cortical thickness patterns between those who have AD parents with those with no family history of AD. Results from this study are congruent with previous studies in preclinical AD (Berti et al., 2011, Fennema-Notestine et al., 2009, Honea et al., 2010) and have new implications for future AD research.
Family History
That cortical thickness did not differ between AD offspring and non-AD offspring is not particularly surprising given that typical AD-related cortical atrophy as measured in MRI may not be readily apparent at this stage (Aisen et al., 2010). However, we found that AD offspring exhibit a relationship between cortical thickness and age that is different than non-AD offspring: AD offspring showed aging related cortical thinning in large regions of precuneus, isthmus cingulate, superior parietal, superior frontal, inferior frontal, supramarginal, insula, superior temporal gyrus, middle temporal, inferior temporal, fusiform gyrus, entorhinal and lateral occipital cortices. Many of these regions have been found to show atrophy in individuals with mild cognitive impairment or AD when compared with cognitively normal elderly individuals (Karas et al., 2007, McDonald et al., 2009, Querbes et al., 2009). For example, Desikan et al (2009) found that cortical thickness measures of the supramarginal, isthmus cingulate, lateral occipital and middle and inferior temporal gyri could discriminate individuals with MCI from healthy controls. Lerch et al (2008) combined cortical thickness measures from the inferior frontal gyrus and parahippocampal gyrus (which includes entrohinal cortex) powerfully discriminated AD patients from healthy controls. Further, the patterns of negative correlation between cortical thickness with age from our present study of preclinical AD visually overlap with regions with increased amyloid deposition, cortical atrophy and metabolic disruption in AD patients (Buckner et al., 2005). In comparison, non-AD offspring showed a different pattern of cortical thinning as a function of age, including the lingual, fusiform and superior temporal regions. Other studies have reported normal cortical thinning patterns in healthy aging individuals that include these brain regions. For example, Fjell et al (2009) reported more extensive cortical thinning patterns in an older population of healthy individuals aged 55–90.
Female AD offspring
We found that female AD offspring showed cortical thinning as a function of age in brain areas that have been associated with cortical atrophy in AD, and such pattern did not exist in male AD offspring. Women have higher incidence rates of AD and therefore are at a higher risk for developing AD than men (Lautenschlager et al., 1996). While many researchers propose that the reason is because women live longer than men (Hebert et al., 2001, Kawas et al., 2000) and that aging-related decreases in levels of estrogen in women which has protective effects against AD may increase the risk of AD (Bendlin et al., 2010), others demonstrated that female may be biologically more susceptible to AD-related excitotoxicity than males in animal models (Zhang et al., 2008). Our findings lend support to the theory that women have a biological susceptibility to AD that is independent from longer life expectancy.
AD offspring with Maternal Heritability
We found that AD offspring with maternal heritability showed cortical thinning as a function of age in brain areas that have been associated with cortical atrophy in AD, and such pattern did not exist in AD offspring with paternal heritability. Gender of AD parent has been hypothesized to influence the heritability of AD. In a similar study of cognitively healthy adult children of AD patients, Honea et al (2010) found that maternal heritability was correlated with lower gray matter volume in the offspring, and Mosconi et al 2007 (2007) found that cognitively healthy adult children whose mothers had AD showed reduced cerebral glucose metabolism, a feature seen in AD patients. Our findings complement and extend the growing literature that maternal transmission of AD is greater than paternal transmission.
Limitations, Conclusions and Future Directions
Limitations of our study include the small sample size of male AD offspring, which led to the analysis of this particular sample being underpowered. Other limitations are the lack of longitudinal data, which are currently being collected, and inclusion of other assessments in the current analysis, e.g., amyloid deposition as measured by PIB-PET. Future directions for this study should include longitudinal data in order to ascertain specific facts that are most predictive of dementia onset. Neuropsychological assessments will be helpful in the longitudinal follow-up of cognitive decline. Inclusion of other imaging modalities such as PIB-PET and resting-state functional MRI will be beneficial in terms of relating age-related gray matter changes with changes of brain function and pathology (Pike et al., 2007, Rombouts et al., 2005, Sheline et al., 2010).
In summary, we found that cognitively healthy, middle-aged adult AD offspring showed patterns of age-related cortical atrophy that overlap with patterns of cortical atrophy often observed in patients with AD, and that these patterns did not exist in non-AD offspring. We further noted that these changes began at around age 60. The similarity of cortical thickness patterns between our study and these previous studies of AD suggests that those with a family history AD, particularly women or those with a maternal history of AD, may be at higher risk for developing AD and that cortical thickness measures as a function of age may be an antecedent biomarker for this risk.
ACKNOWLEDGEMENT
This research was supported in part by NIH grants P01-AG026276, P50-AG05681, and Pacific Alzheimer Research Foundation grant 869294. The sponsors have no role in the design and conduct of the study; collection, management, analysis, and interpretation of the data; and preparation, review, or approval of the manuscript. The principal investigator (JGC) takes responsibility for the integrity of the data and the accuracy of the data analysis.
Footnotes
Publisher's Disclaimer: This is a PDF file of an unedited manuscript that has been accepted for publication. As a service to our customers we are providing this early version of the manuscript. The manuscript will undergo copyediting, typesetting, and review of the resulting proof before it is published in its final citable form. Please note that during the production process errors may be discovered which could affect the content, and all legal disclaimers that apply to the journal pertain.
References
- Aisen PS, Petersen RC, Donohue MC, Gamst A, Raman R, Thomas RG, Walter S, Trojanowski JQ, Shaw LM, Beckett LA, Jack CR, Jr, Jagust W, Toga AW, Saykin AJ, Morris JC, Green RC, Weiner MW. Clinical Core of the Alzheimer's Disease Neuroimaging Initiative: progress and plans. Alzheimers Dement. 2010;v. 6:239–246. doi: 10.1016/j.jalz.2010.03.006. [DOI] [PMC free article] [PubMed] [Google Scholar]
- Bendlin BB, Carlsson CM, Gleason CE, Johnson SC, Sodhi A, Gallagher CL, Puglielli L, Engelman CD, Ries ML, Xu G, Wharton W, Asthana S. Midlife predictors of Alzheimer's disease. Maturitas. 2010;v. 65:131–137. doi: 10.1016/j.maturitas.2009.12.014. [DOI] [PMC free article] [PubMed] [Google Scholar]
- Berti V, Mosconi L, Glodzik L, Li Y, Murray J, De Santi S, Pupi A, Tsui W, De Leon MJ. Structural brain changes in normal individuals with a maternal history of Alzheimer's. Neurobiol Aging. 2011;v. 32:2325, e17–e26. doi: 10.1016/j.neurobiolaging.2011.01.001. [DOI] [PMC free article] [PubMed] [Google Scholar]
- Bu G. Apolipoprotein E and its receptors in Alzheimer's disease: pathways, pathogenesis and therapy. Nat Rev Neurosci. 2009;v. 10:333–344. doi: 10.1038/nrn2620. [DOI] [PMC free article] [PubMed] [Google Scholar]
- Buckner RL, Head D, Parker J, Fotenos AF, Marcus D, Morris JC, Snyder AZ. A unified approach for morphometric and functional data analysis in young, old, and demented adults using automated atlas-based head size normalization: reliability and validation against manual measurement of total intracranial volume. Neuroimage. 2004;v. 23:724–738. doi: 10.1016/j.neuroimage.2004.06.018. [DOI] [PubMed] [Google Scholar]
- Buckner RL, Snyder AZ, Shannon BJ, LaRossa G, Sachs R, Fotenos AF, Sheline YI, Klunk WE, Mathis CA, Morris JC, Mintun MA. Molecular, structural, and functional characterization of Alzheimer's disease: evidence for a relationship between default activity, amyloid, and memory. J Neurosci. 2005;v. 25:7709–7717. doi: 10.1523/JNEUROSCI.2177-05.2005. [DOI] [PMC free article] [PubMed] [Google Scholar]
- Debette S, Wolf PA, Beiser A, Au R, Himali JJ, Pikula A, Auerbach S, Decarli C, Seshadri S. Association of parental dementia with cognitive and brain MRI measures in middle-aged adults. Neurology. 2009;v. 73:2071–2078. doi: 10.1212/WNL.0b013e3181c67833. [DOI] [PMC free article] [PubMed] [Google Scholar]
- Desikan RS, Cabral HJ, Hess CP, Dillon WP, Glastonbury CM, Weiner MW, Schmansky NJ, Greve DN, Salat DH, Buckner RL, Fischl B. Automated MRI measures identify individuals with mild cognitive impairment and Alzheimer's disease. Brain. 2009;v. 132:2048–2057. doi: 10.1093/brain/awp123. [DOI] [PMC free article] [PubMed] [Google Scholar]
- Edland SD, Silverman JM, Peskind ER, Tsuang D, Wijsman E, Morris JC. Increased risk of dementia in mothers of Alzheimer's disease cases: evidence for maternal inheritance. Neurology. 1996;v. 47:254–256. doi: 10.1212/wnl.47.1.254. [DOI] [PubMed] [Google Scholar]
- Fennema-Notestine C, Hagler DJ, Jr, McEvoy LK, Fleisher AS, Wu EH, Karow DS, Dale AM. Structural MRI biomarkers for preclinical and mild Alzheimer's disease. Hum Brain Mapp. 2009;v. 30:3238–3253. doi: 10.1002/hbm.20744. [DOI] [PMC free article] [PubMed] [Google Scholar]
- Fjell AM, Walhovd KB, Fennema-Notestine C, McEvoy LK, Hagler DJ, Holland D, Brewer JB, Dale AM. One-year brain atrophy evident in healthy aging. J Neurosci. 2009;v. 29:15223–15231. doi: 10.1523/JNEUROSCI.3252-09.2009. [DOI] [PMC free article] [PubMed] [Google Scholar]
- Fleisher AS, Sherzai A, Taylor C, Langbaum JB, Chen K, Buxton RB. Resting-state BOLD networks versus task-associated functional MRI for distinguishing Alzheimer's disease risk groups. Neuroimage. 2009;v. 47:1678–1690. doi: 10.1016/j.neuroimage.2009.06.021. [DOI] [PMC free article] [PubMed] [Google Scholar]
- Gomez-Tortosa E, Barquero MS, Baron M, Sainz MJ, Manzano S, Payno M, Ros R, Almaraz C, Gomez-Garre P, Jimenez-Escrig A. Variability of age at onset in siblings with familial Alzheimer disease. Arch Neurol. 2007;v. 64:1743–1748. doi: 10.1001/archneur.64.12.1743. [DOI] [PubMed] [Google Scholar]
- Hebert LE, Scherr PA, McCann JJ, Beckett LA, Evans DA. Is the risk of developing Alzheimer's disease greater for women than for men? Am J Epidemiol. 2001;v. 153:132–136. doi: 10.1093/aje/153.2.132. [DOI] [PubMed] [Google Scholar]
- Honea RA, Swerdlow RH, Vidoni ED, Goodwin J, Burns JM. Reduced gray matter volume in normal adults with a maternal family history of Alzheimer disease. Neurology. 2010;v. 74:113–120. doi: 10.1212/WNL.0b013e3181c918cb. [DOI] [PMC free article] [PubMed] [Google Scholar]
- Janicki SC, Schupf N. Hormonal influences on cognition and risk for Alzheimer's disease. Curr Neurol Neurosci Rep. 2010;v. 10:359–366. doi: 10.1007/s11910-010-0122-6. [DOI] [PMC free article] [PubMed] [Google Scholar]
- Karas G, Scheltens P, Rombouts S, van Schijndel R, Klein M, Jones B, van der Flier W, Vrenken H, Barkhof F. Precuneus atrophy in early-onset Alzheimer's disease: a morphometric structural MRI study. Neuroradiology. 2007;v. 49:967–976. doi: 10.1007/s00234-007-0269-2. [DOI] [PubMed] [Google Scholar]
- Kawas C, Gray S, Brookmeyer R, Fozard J, Zonderman A. Age-specific incidence rates of Alzheimer's disease: the Baltimore Longitudinal Study of Aging. Neurology. 2000;v. 54:2072–2077. doi: 10.1212/wnl.54.11.2072. [DOI] [PubMed] [Google Scholar]
- Lautenschlager NT, Cupples LA, Rao VS, Auerbach SA, Becker R, Burke J, Chui H, Duara R, Foley EJ, Glatt SL, Green RC, Jones R, Karlinsky H, Kukull WA, Kurz A, Larson EB, Martelli K, Sadovnick AD, Volicer L, Waring SC, Growdon JH, Farrer LA. Risk of dementia among relatives of Alzheimer's disease patients in the MIRAGE study: What is in store for the oldest old? Neurology. 1996;v. 46:641–650. doi: 10.1212/wnl.46.3.641. [DOI] [PubMed] [Google Scholar]
- Lerch JP, Pruessner J, Zijdenbos AP, Collins DL, Teipel SJ, Hampel H, Evans AC. Automated cortical thickness measurements from MRI can accurately separate Alzheimer's patients from normal elderly controls. Neurobiol Aging. 2008;v. 29:23–30. doi: 10.1016/j.neurobiolaging.2006.09.013. [DOI] [PubMed] [Google Scholar]
- McDonald CR, McEvoy LK, Gharapetian L, Fennema-Notestine C, Hagler DJ, Jr, Holland D, Koyama A, Brewer JB, Dale AM. Regional rates of neocortical atrophy from normal aging to early Alzheimer disease. Neurology. 2009;v. 73:457–465. doi: 10.1212/WNL.0b013e3181b16431. [DOI] [PMC free article] [PubMed] [Google Scholar]
- Mosconi L, Brys M, Switalski R, Mistur R, Glodzik L, Pirraglia E, Tsui W, De Santi S, de Leon MJ. Maternal family history of Alzheimer's disease predisposes to reduced brain glucose metabolism. Proc Natl Acad Sci U S A. 2007;v. 104:19067–19072. doi: 10.1073/pnas.0705036104. [DOI] [PMC free article] [PubMed] [Google Scholar]
- Payami H, Zareparsi S, Montee KR, Sexton GJ, Kaye JA, Bird TD, Yu CE, Wijsman EM, Heston LL, Litt M, Schellenberg GD. Gender difference in apolipoprotein E-associated risk for familial Alzheimer disease: a possible clue to the higher incidence of Alzheimer disease in women. Am J Hum Genet. 1996;v. 58:803–811. [PMC free article] [PubMed] [Google Scholar]
- Pike KE, Savage G, Villemagne VL, Ng S, Moss SA, Maruff P, Mathis CA, Klunk WE, Masters CL, Rowe CC. Beta-amyloid imaging and memory in non-demented individuals: evidence for preclinical Alzheimer's disease. Brain. 2007;v. 130:2837–2844. doi: 10.1093/brain/awm238. [DOI] [PubMed] [Google Scholar]
- Querbes O, Aubry F, Pariente J, Lotterie JA, Demonet JF, Duret V, Puel M, Berry I, Fort JC, Celsis P. Early diagnosis of Alzheimer's disease using cortical thickness: impact of cognitive reserve. Brain. 2009;v. 132:2036–2047. doi: 10.1093/brain/awp105. [DOI] [PMC free article] [PubMed] [Google Scholar]
- Rombouts SA, Barkhof F, Goekoop R, Stam CJ, Scheltens P. Altered resting state networks in mild cognitive impairment and mild Alzheimer's disease: an fMRI study. Hum Brain Mapp. 2005;v. 26:231–239. doi: 10.1002/hbm.20160. [DOI] [PMC free article] [PubMed] [Google Scholar]
- Sager MA, Hermann B, La Rue A. Middle-aged children of persons with Alzheimer's disease: APOE genotypes and cognitive function in the Wisconsin Registry for Alzheimer's Prevention. J Geriatr Psychiatry Neurol. 2005;v. 18:245–249. doi: 10.1177/0891988705281882. [DOI] [PubMed] [Google Scholar]
- Sheline YI, Raichle ME, Snyder AZ, Morris JC, Head D, Wang S, Mintun MA. Amyloid plaques disrupt resting state default mode network connectivity in cognitively normal elderly. Biol Psychiatry. 2010;v. 67:584–587. doi: 10.1016/j.biopsych.2009.08.024. [DOI] [PMC free article] [PubMed] [Google Scholar]
- Wu Z, Kinslow C, Pettigrew KD, Rapoport SI, Schapiro MB. Role of familial factors in late-onset Alzheimer disease as a function of age. Alzheimer Dis Assoc Disord. 1998;v. 12:190–197. doi: 10.1097/00002093-199809000-00011. [DOI] [PubMed] [Google Scholar]
- Zhang XM, Zhu SW, Duan RS, Mohammed AH, Winblad B, Zhu J. Gender differences in susceptibility to kainic acid-induced neurodegeneration in aged C57BL/6 mice. Neurotoxicology. 2008;v. 29:406–412. doi: 10.1016/j.neuro.2008.01.006. [DOI] [PubMed] [Google Scholar]


